Default Rate and Seth Klarman on Junk Bonds
March 1st, 2012 by PotatoA rolling loan gathers no loss.
I’ve long said that the mortgage default rate has no predictive value in spotting housing market trouble: it’s a lagging indicator. The reason is very common-sense: as prices increase rapidly, even someone with no equity to start with can refinance after a year or two, or sell and be able to cover the transaction costs. There is no reason to default in a rising market unless you’re particularly bad at arranging your finances and can’t even make it a few months to be rescued by the rising tide.
Then I was reading something about the junk bond fiasco of the 80’s and came across another interesting feature of credit bubbles. As you lend to less and less creditworthy people/businesses, your eventual loss rate will increase — those chickens eventually come home to roost. But firstly, rolling loans gather no losses: with loose credit, and increasing valuations on the underlying collateral, it’s very easy to just borrow your way out of trouble for the short term. Even then, the defaults don’t occur immediately except in the most egregious of cases (which did happen at the end of both the junk bond craze and the US subprime debacle). Another feature is that you increase the size of the lending pool as the credit bubble inflates. So if you look at the default rate, it may be flat even though the number of defaults is steadily increasing — just not quite as fast as the denominator (total credit) is also increasing. That makes the default rate look better than it really is, and doubly so when combined with the lag time before a loan defaults. Seth Klarman says that you could have spotted the junk bond crisis before the bust by looking at the default rate and adjusting for the increase in the denominator.
To give a quick example of how that would work, say your default rate is steady at 1% — this is a level you are happy with and for decades in your industry has been a level that indicates there’s no trouble. Then you rapidly increase the size of your loan portfolio, doubling it within say 6 months. You should have zero defaults on the new loans since they haven’t had time to default, so your default rate should be halved now. If it’s still 1%, you have a problem, and may not realize it.
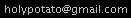
So I went to look up some Canadian mortgage data. As expected, the default rate is low. It was rock-bottom when the 90’s first started, as prices were at their peak there. Then as Toronto’s bubble crashed out and the economy worsened, the default rate increased, topped out at about 0.7%, and then improved. Around the economic crisis and recession in 2008/2009 (also when Alberta prices started their “soft landing”) the rate increased modestly, but is still generally fairly low. That’s the blue line, and is a chart you’ve probably seen many times before.

But in that dataset is also the total number of mortgages, and that has increased much faster than the population growth rate: if you assume that the year 2002 is a “normal” period to start from, and increase the mortgage size with our population growth rate (1.1-1.2% according to Google), then in 2012 we should have just about 3.7M mortgages. Instead, that number is higher by about 16%. If you then take the number of defaults, and compare them to that denominator, you get an adjusted default rate in red — and that is, by the conservative historical standards of our country, fairly high. And this is still a lagging indicator. But on an absolute basis, it’s still pretty low: while the growth in the mortgage pool has been tremendous by mortgage standards, the dilution of the denominator isn’t as dramatic as it was with junk bonds.
To cut it up a different way, consider the situation as separate pools of mortgages. You’ve got say 3.7M mortgages that represents the normal, conservative Canadian lending market that everyone likes to talk about. These are the people that would own their houses no matter what the real estate boards were projecting, many have been in real estate for decades and have significant equity. With times being reasonably good and house prices being at record highs, we might expect the default rate on this pool to be near its lows of 0.1-0.2%. Let’s be generous and say it’s even higher than that — 0.25% — so this pool of mortgages represents about 9300 of our defaults today.
Then we have the 560k new mortgages that represents all the insanity of the past 12 years: demand pulled forward, low downpayments, long amortizations, teaser rates, fuzzy thinking — whatever it was that drew these people into the market that maybe shouldn’t have been there in the first place. Of that pool, 140k were issued just in the last year alone. Since we don’t expect defaults to occur immediately unless there is a huge problem in underwriting, we wouldn’t think of defaults as coming from those. That leaves 420,000 mortgages issued in the last 10 years that would be responsible for 7000 of the defaults, a rate of 1.7%. The default rate separated out for this pool is put in pink on the graph. As an aside, it goes off-scale in 2009 — in part because the fixed 0.25% default rate assumption simply wasn’t true for the regular mortgage pool (times weren’t great), and in part because that’s when house prices stopped going up and actually went down (briefly).
Now, this is all back-of-the-envelope and full of room for error. This is not the one peg I’d hang my housing bear hat on (that would be price-to-rent). But it is another way of looking at things that I hadn’t come across before.


 Questrade: use QPass 356624159378948
 Passiv is a tool that can connect to your Questrade account and make it easier to track and rebalance your portfolio, including the ability to make one-click trades.