The Misbehavior of Markets
August 6th, 2010 by PotatoI just finished reading The Misbehavior of Markets by Benoit Mandelbrot.
It’s a concept book: it’s not going to tell you how to better manage your money or anything of the sort. There aren’t a lot of concrete examples, either. However, it discusses a number of important concepts, especially the important ways that we model the markets differ from reality. Models are of course important for being able to manipulate variables, to try to forecast the future, or to simplify things to get a better understanding. However, relying too much on models that are not accurate can bite us in the ass. “Clouds are not spheres, mountains are not cones, coastlines are not circles, and bark is not smooth, nor does lightning travel in a straight line.”
First, a quick bit in the way of introduction for those that don’t have a strong stats background. The Gaussian, or normal distribution is one that appears in a lot of places in nature (so much so that we call it the “normal” one!), even if you’re not very familiar with it, you must have seen the familiar bell-curve shape:
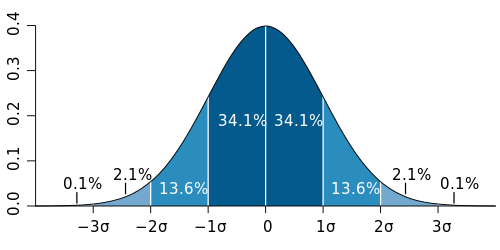
It looks a little different for every group of things you choose to measure. For instance, the lengths of pencils in a fresh box may have a very “sharp” bell curve, since each one is very nearly identical in length, varying by just fractions of a millimetre. The heights of adults in the population will be a bit wider, with some people towering head and shoulders above others. The heights of kids in a school may have a wider one yet, with some being young, some passing through their growth spurt. But for all these disparate measurements, you can describe the way their bell curve looks with just two numbers: the mean, and the standard deviation (σ). The mean tells you where the centre of the curve is, and the standard deviation how wide it is.
A lot of work has gone into investigating and characterizing these distributions. A very large part of the whole field of statistics is based on manipulating the properties of the normal distribution. There are countless tools out there to help you simulate or analyze data based on normal distributions. In addition to being common, the math is also fairly well-behaved, lending itself to analytical as well as numerical approaches.
So it may be no surprise then that a great number of tools exist for financial matters based on gaussian distributions. For example, if you go to a retirement planner, and they have a fancy program that will show you the various possible outcomes for how much money you’ll have to retire on based on how much you save, saying things like “95% of the time, you’ll have at least $X available per year until you turn 100” — those software tools are based on simulating possible market outcomes with this math. Options traders have formulas to tell them how much their derivatives should be worth based on these formulas. Etc.
Yet, as Mandelbrot eloquently shows in the book, markets do not follow a Gaussian distribution. There are far too many wild swings than should be seen in a normal distribution. These swings, such as the 1929 stock market crash that kicked off the Great Depression, the 1987 Black Monday crash, the Tech Wreck, the 2008/9 global financial crisis — they simply shouldn’t happen if the markets were following a random walk with the volatility implied by a normal distribution. The standard models say that these types of events should be so rare as to be essentially impossible, like finding a human closing on the 10′ mark for height — basically, never in the course of human history should any of these events have happened, but there they are, and more that I haven’t listed, all within about one human lifespan. This volatility is, unfortunately, an inescapable feature of the markets.
Other core assumptions of the standard theories are also not true. For example, that price movements are independent. But, we know that volatility clusters. This is even something seen in nature, away from the madness of human market psychology: if you plot out the size of a river’s spring flood each year for hundreds of years, it will trace a nice bell-curve. If, using the information of that bell curve you were to make a dam so that, 99 years out of the 100 you expect the dam to last, the reservoir would be big enough to allow enough water to flow downstream to provide a water supply equal to the average spring flood, you’d find your dam would be too small. That’s because if the volatility clusters, it throws the calculations off. And that’s exactly what happens when you find that one dry year follows another follows another, while the wet ones cluster up together too — more often than should be happening if each was truly an independent event, as with games of chance in a casino.
Forgetting this assumption is one of the many factors that lead to the subprime crisis in the states. They had fairly decent models telling them how likely it was that someone with bad credit they were giving a mortgage to would default. These financial warlocks could then figure out how to tranche the loans out in a big securitization package so that the top tranche would not experience any defaults (and then later what interest rate they’d need to offer to get people to take a chance on the lower tranches). However, what they didn’t account for is the clustering of volatility — when the loans went bad, they all went bad at the same time.
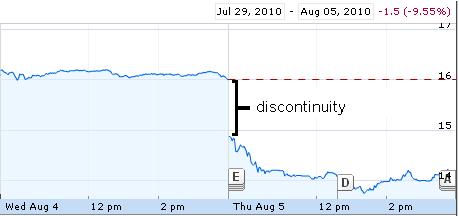
And the third important way that real markets differ from our models of markets is that prices are not continuous. Many real physical things are continuous. It’s not possible for me to teleport my keyboard from the top of my desk to the floor. It must — however briefly — occupy each point along the height axis as it falls. Much of our mathematics is based on continuous functions. Markets, however, are not real, physical things. They are not continuous. However, the models assume that they are. For most retail investors, this is one of the less devastating distinctions from accepted theory: so what if prices take discrete jumps? For the fancy traders trying to limit risk though, non-continuity can break some of their techniques. One common one is the stop-loss order. You set a point at which you will not tolerate further drops in a stock’s price. If the stock is falling and hits your stop-loss price, it automatically gets sold by your broker. This can help you limit your downside.
But look at Manulife today. Let’s say a trader owned MFC and had a stop-loss set at $15.50, to limit their downside. This morning the results came out, and they were bad. The stock, which closed yesterday at $16 opened for trading today at $14.87. At no point was there ever an opportunity to sell it in the $15 range.
So, before I get off ranting about the concepts themselves, I’ll say that the book was very approachable, even if you don’t have much of a statistical bent. Mandelbrot uses graphs well to get his point across, and tries to keep things non-technical (and there is next to no math). However, it is a concept book — it’s not going to tell you how to build a better portfolio or manage risk better.
Now, having just spent some time discussing the idea that markets are more volatile than we thought, and that they are not efficient, what do I have to say?
Well, despite the volatility, for the long run the stock market has still been basically the best place to keep your money. In the short run, the volatility can be very painful (as we’ve seen recently). But, if you have many decades to wait, and believe that businesses will continue to be profitable, then you should get your money to work for you in the market. So, as someone still fairly young (despite my looks as science has ravaged my body), I have a very high equity allocation. However, despite agreeing in theory with the concept of lifecycle investing and using leverage while you’re young, I’ve never been comfortable with the idea in practice, and have never been very leveraged (and not at all at the moment).
Efficient market theory says that market participants are rational, have (roughly) equal access to information, and that information about past price changes does not enable you to predict future price changes. (The esoteric proofs of some of this rely on the normal distribution). This leads one to conclude that investing in index funds is the way to go, since beating the market is impossible. Now, I don’t believe in full efficient market theory. In particular, people are not rational, and all information is not widely and universally shared (or understood!). That’s why part of my investments are “actively” managed: I invest in particular companies I think have a good chance of beating the overall market. However that said, I do believe in a weaker form of efficient markets, which is that the average person can’t beat the market net of fees, so although I talk about my stock tips and analysis here on the blog for discussion and feedback, the only recommendation I ever give people who ask is to invest in a low-cost index fund, such as TD’s e-series funds or an iShares ETF (and part of my investments are in e-series funds).


 Questrade: ETFs are free to trade, and if you sign up with my link you'll get $50 cash back (must fund your account with at least $250 within 90 days).
  Passiv is a tool that can connect to your Questrade account and make it easier to track and rebalance your portfolio, including sending you an email reminder when new cash arrives and is ready to be invested.

August 6th, 2010 at 9:14 am
Good article. You’ve captured Mandelbrot’s message well.
August 6th, 2010 at 6:20 pm
I have always wanted to read that book but never got around to it. Your review gives me a good idea what it’s about.
August 20th, 2010 at 9:18 am
The Efficient Market Hypothesis does not assume people are rational or have any particular level of access to information. It merely states (with varying degrees of assertiveness) that it’s impossible to predict future stock prices.
In case you’re interested, I posted my own thoughts on the issue in January.