2013 Active Investing Update

January 26th, 2014 by Potato

A quick update to my 2013 active investing summary. Because Michael James put together a neat graph of his investing history, I thought I should make one as well. I don’t have as much history as he does (and I didn’t have a year so positive I needed drawing tools to break the line) so it’s not quite as impressive. My benchmark is a 50/50 mix of the Canadian and S&P500 e-series funds (all my rest-of-world exposure comes in through the passive portfolio). Like him, I had losses a bit worse than the benchmark in 2008, snapped back very strong in 2009, and lost a bit more in 2011. At this point you may notice I’ve had three out-performing years, and three under-performing years. Except for the fact that the magnitude of the out-performing years was (much) higher than the losing ones, this would look very depressing. As it is, it looks much like a coin-toss. It’s quite possible that I have no skill and this was a matter of luck. To defend against that I do passively invest (my RRSP and now Blueberry’s RESP are totally indexed), and it’s the approach I recommend for everyone1.

I also forgot to repeat my brief approach summary: I try to capture some of the benefits of a passive approach by trading as little as possible. In 2013, my equivalent MER from commission costs was 0.15% (this was helped along by the lack of savings while Wayfare was on mat leave for the first half of the year). Because I know that I am the easiest person to fool, savings from 2014 will go to the indexed portfolio (even though, as Wayfare pointed out, this is the equivalent of performance-chasing — I’m ok with that because I don’t have any buy ideas now anyway).

A boring old bar graph showing how my investing returns stacked up against a benchmark

1. Well, practically everyone. Everyone who isn’t willing to take some accounting courses, read balance sheets and all the footnotes until 2 in the morning on a work night, or suffer through volatility and downturns — and call it fun all the while. Oh, and stuff their puny human emotions into a box and jettison it into space. So yeah, everyone.

Course Adjustments

January 16th, 2014 by Potato

Let’s think of financial planning as taking a voyage across the ocean. I appreciate that this is likely a poor choice of metaphors as I am not a sailor and neither are you, but let’s work through it.

You set off with some destination in mind. Checking the map and detailed charts with the typical winds and currents ahead, you draw a line to plot your course (with the help of some basic high school trigonometry to factor in the wind and current). A glance at the stars to be sure, you set your sails and put your back into the oars. The journey of a lifetime!

Within minutes you find you’re off course: a particularly larger than average wave has just moved your bow a degree off course and slowed you imperceptibly (though your instruments can give you the course deviation to two decimal places). No matter, a quick calculation, a pull on the oars and an adjustment of the rudder has set you right again. Then another wave. And a gust of wind… which then suddenly dies.

The conclusion is obvious: you simply can’t adjust for every ripple, it would drive you mad and lead to needless effort trying to compensate for tiny effects that may just cancel themselves out anyway. But you can’t very well cross an ocean without making a few course adjustments, otherwise when you do hit shore (if you hit shore) you may find out that you’re way off target. Ending up in Bangor, Maine is way worse than ending up in Newfoundland. Have you read Stephen King’s documentaries on the horrors plaguing Maine? Some kind of compromise has to be reached that will let you respond to the important changes so that you can get back on course, without over-correcting to everything.

You can play it by ear, and try to feel your way towards a happy medium, but that might involve some white-knuckle moments early on as you over-react to every tiny ripple along the way. In physics we (by which I mean Michael James) might put a low pass filter on the response function, or perhaps a hysteresis, to make the input-adjustment mechanism work better. When sailing you might only check the stars once a night, and hold the tiller steady against the waves.

To leave the metaphor and talk about financial planning, for problems like this there are lots of other practical solutions. You could just limit how often you check when you’re off course (once a year, say), or act only when you’re off course by some threshold (like when your asset allocation is off by more than 5%). Many of these adjustments will be minor if the perturbation is small: normal fluctuations in return or expected lumpiness in your monthly spending. Some will come on suddenly: though you may model and anticipate inflation as a continuous, steady percentage, you may find instead that your bills are perfectly flat through the year until March when your utilities jump 7% all at once while Mac & Cheese goes from $0.99 to $1.29 without hitting any of the intermediate values.

Some adjustments may be more major, and require much more of an effort to correct for. Like disability, losing a job, or a major global market crash. They’re also usually highly emotional times, which can lead to less-than-optimal decision-making. The midst of a market crash is the last time you want to be re-evaluating your risk tolerance and end up selling low, and while you’re sick may not be the time to rework your financial plan. So part of the planning process should, ideally, involve sketching out your course corrections in advance.

I don’t much care precisely how you go about it or what your contingency plans are, just that you think about it and come up with some. Don’t want to dictate how you make your course adjustments, just that you do. Thankfully, Michael James had a recent post on coming up with a formula for adjusting spending in retirement based on changes in portfolio returns. A generalized scheme might have two relatively simple components:

1. Identify, in advance, points where you will assess your progress. Decide how you will measure that progress, and what deviation would call for corrective action. What events are worth responding to, which aren’t?

2. Decide what action you will take while things are calm and you have your background research front of mind. Write your contingency plans down. You don’t want to be making those decisions while emotional after realizing that your plan is not working out, or trusting a plan from years earlier to a foggy memory.

For example, if you find after 5 years that your savings rate has lagged (perhaps because you can’t stay on budget, perhaps because of several emergencies/unemployment/etc), how would you get back on track? What would you do to your budget, how would your investments change? If equity returns were lower than planned for 10 years, would you put more into equities because you expect some mean reversion, or less because they’re losing and dumb? This is one area where your answer in advance might be different than your emotional answer later, and where you get into sticky questions of whether the data that led to your expected values was simply wrong. Would you stick with your asset allocation and adjust your budget?

What if things were looking better than planned: you had more money saved thanks to good budget discipline, luck, or good equity markets. Would you relax your budget and let yourself spend more, or would you remove some risk by shifting your asset allocation? Perhaps you’d prefer to stick to the original plan and keep the extra headroom — if there continues to be a surplus your heirs can have it, or you can retire early.

There is uncertainty in the world. This makes people deeply uncomfortable. The solution is not to pretend that the uncertainty is not there, but to prepare for it.

So Done with Bell

January 8th, 2014 by Potato

I’ve been a Bell home phone user forever. With two multi-day power outages in the last decade, and multiple 8-12 hour outages with loss of cell reception in the last year, the sheer reliability of plain old telephone service (POTS) is a feature I like and am willing to pay for over digital IP options. Plus the quality — I can’t stand talking on my cellphone and will call people back if I’m at home (or at my desk at work) and they try my mobile.

However, Bell is expensive, and has a ridiculous notion of inflation. For a service that has not really required any capital investment on their part or high marginal costs, the rate has gone up by about triple that of CPI over the last decade, and with a 7% increase this year on our bill, it was one straw that made me want to cancel. They’re also more expensive than their competitors (like Teksavvy), but we know Bell — as much as I may hate having to call their telemarketing department, the service just works and we can rely on it to continue to work. That should be the case for a POTS reseller as well, but we were willing to pay a few dollars more per month to stick with Bell. Yet the gap was significant at around $10-20 per month, so we used the old trick of calling to complain and got a discount to bring it closer. A $10/mo discount for 12 months was a small price for Bell to pay to keep us happy and loyal, and make the price a little more fair. And when that would expire we’d call back and renew it, often missing out on a month in-between without a discount.

This has been the routine for years now. It’s tiring and I keep asking if they can just put a permanent reduction in the rate to make it competitive, but the constant threat to cancel with discount is just their mechanism. It’s how they do business, so that’s the game plan we follow. Yet this year when I called in, they wouldn’t give it to me. They would give me a “great” rate on internet and TV if I switched everything over to them, but that’s not happening (Bell: you burned too hard on UBB to try to pretend you have an affordable unlimited service now). As a phone-only customer, I could take my business elsewhere: they didn’t want it.

What really set me off though was the incredibly awful and shady accounting practice they had for the end of the discount. Rather than immediately seeing that the 12-month discount had expired, they continued to put it on my bill, and charge me the reduced rate. Then in a later month they retroactively took it back and hit me with a massive one-time bill. Likewise, on the first bill with the new, 7% higher (in a year when inflation is less than a percent) rate, they retroactively applied it to the previous month. That is needlessly infuriating. In essence, it’s a billing error. I shudder to think of the damage that could be done with such practices for someone living closer to the edge in their budget, with multiple services with Bell, opening their bill one day to see a (one-time) double payment required.

I finally had enough of it and have switched. I tried Teksavvy first — great prices and I love them for internet — but they wouldn’t take my money. For whatever reason, Teksavvy has put in a “stop sale” on home phone service. Even though it’s still advertised on their website, they won’t take me as a phone customer. Primus would however, so off I go (though they are a touch pricier than Teksavvy’s unobtainable teaser pricing).

Why Do Pensions Exist if the Future is Discounted?

December 17th, 2013 by Potato

In today’s post at Michael James on Money, he mentions that we can’t extend generous government pensions to everyone.

Here’s something that I’ve never really understood: how is it that there are so many defined benefit pension plans? The news seems to be full of stories of underfunded pensions (another one today about Canada Post’s), and while I can see the logic that led to underfunding, due to the management of the plan and various incentives, I’m amazed that the plans exist at all. The issue is that people are terrible discounters of the future. I would think it should be easy to convince someone to take a minor increase in pay now over a future pension obligation. I would also think that the individual workers would be worse at that kind of math than the corporations and governments employing them.

Yet pensions exist, so what’s wrong with this thinking?

Perhaps an additional factor to future discounting is uncertainty: having a pension means people don’t need to wade into the dark waters of investing: their future will be taken care of, and that certainty (and service of freeing workers from saving and investing on their own) might trump their over-discounting of future payoffs.

Or maybe the organizations suffer from the discounting more than I had thought. Perhaps the present seems so make-or-break that they figure if they don’t keep current costs low (and thus make expensive future promises), they won’t be around to have to deal with the pension. It could be a dissociation between the organization and those negotiating in the present: the elected officials or car company negotiators figure they won’t be around when the bill comes due, so make some deals that are cheap in the short term.

If the certainty is a large factor in making workers value pensions, that might present an interesting opportunity and psychological approach for helping people think about their future selves and save/invest more on their own.

Wonky Buy vs Rent Calculator

December 11th, 2013 by Potato

One of my shining triumphs here has been to create (with generous help from Matthew Gordon) the ultimate buy-vs-rent calculator tool (direct link to the spreadsheet).

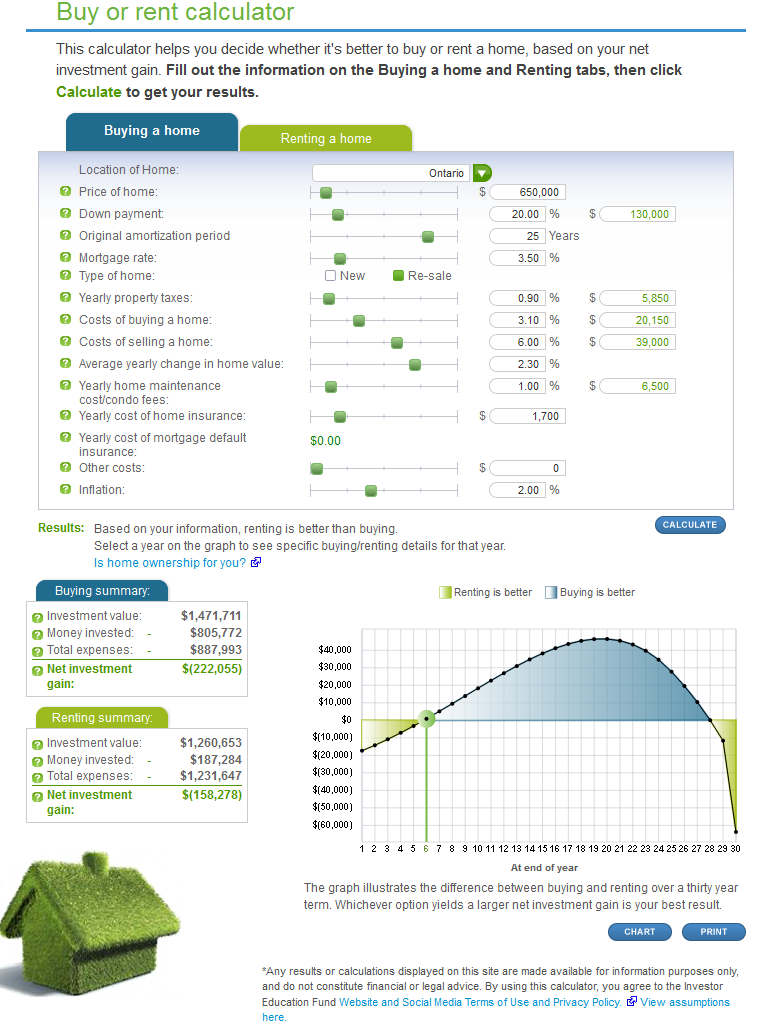
The beautiful thing about a spreadsheet-based calculator like that is that you can follow the calculation, item-by-item, and check it for bugs if you get unexpected results. Earlier this week, B&E posted a list of calculators out on the net, and rather than linking to my supremely excellent calculator and associated post, Robb linked to a Get Smarter About Money calculator. Ok, it’s web-based and a little more user-friendly than a spreadsheet, and has graphs and sliders (though why you need house price to go up to $10M is a question left unanswered)… but was it accurate? I’ve seen many, many terrible buy-vs-rent calculators (even some seemingly excellent ones like the famous New York Times ones that just doesn’t work for Canadians due to tax differences). So I played around with it. And I quickly saw wonky results like this:

Weird behaviour from a buy-vs-rent calculator: the curve simply should not be shaped like that, there's nothing to drive the differences in the last few years. Click to enbiggen.

In the comparison I have there, the price-to-rent multiple is 260X ($2500 monthly rent on a $650,000 house); as we’ve learned from previous posts in realistic scenarios it should be better to rent with prices so detached from rents. Yet here the calculator is showing a rather large benefit to buying if you can only wait 7 years or more. Then, strangely and inexplicably, renting rapidly takes the lead in the final few years of the comparison, with some sort of apparent discontinuity at year 30. If you look at their “chart” you can see more errors immediately: I had entered $2500/mo in rent, which is $30,000 per year, yet the “total renting expenses” came to just $12,360 in their chart, a factor of three too low. The buying expenses were only about $31k in their chart, whereas the mortgage alone is that much, with a total cash outlay of nearly $45k each year.

Now if you instead do the same comparison in my calculator, you’ll find that renting beats buying right from the start (due to the high transaction costs), and is fairly flat in terms of net benefit for about 10 years, at which point the investment portfolio starts to get large enough that investment returns become comparable to rent and the exponential growth becomes truly noticeable. There is no big “buying is better” hump in the middle. Moreover, the magnitude of the difference is notable: in my calculator renting beats buying in such a scenario by over $600,000 in year 30, versus the nearly break-even result from this scenario in the flashy online tool, with the same assumptions regarding investment returns, inflation, mortgage interest, and other sundry costs.

It’s a bit distressing, as other online calculators have recently been found to have serious errors as well. For instance, Michael James uncovered one on the Globe & Mail’s site, and just today news broke on retirehappy about the government’s CPP calculator over-estimating your future CPP benefits and not at all handling early retirement scenarios correctly.

Footnote: let’s say you’re not convinced that my spreadsheet is the gold standard to which all other rent-vs-buy calculators should be held. To then check the accuracy of the online calculator, let’s run the first year’s numbers manually:
Buying: mortgage $31k, property tax $6k, insurance $1.7k, maintenance $6.5k; total cash cost: $45.2k. Principal paid down: $16.5k. Net cost of owning: $28.7k.
Renting: rent $30k, insurance $0.4k; total cash cost: $30.4k. Investment portfolio gains: $10.5k. Net cost of renting: $19.9k. Cost to sell house: $39k. Gain on house: $15k. After year 1, renting ahead by: $49.3k. Online tool says: $16k.
If you notice any errors let me know.