BMO Mortgage Special

March 17th, 2012 by Potato

I’ve been scratching my head about the BMO special since the first iteration in January.

It’s puzzling because it seems so unprecedented: I can’t recall the banks openly competing on price this much before. I can think of a few reasons for it, but those don’t give me much comfort in the motives:

1. BMO is willing to trade margin for marketshare. This could work long-term for them, since many of these customers will renew in 5 years with BMO at higher spreads, but aggressive banks aren’t comforting. There’s a reason we like to comfort ourselves with the image of the conservative Canadian bank. There are news reports that BMO has been losing market share, which could explain this push to take it back, but desperation is no better a trait than aggression in a bank.

2. It’s about funnelling people into fixed rates. The 2.99% special is a lower rate than their (posted) variable-rate mortgage, and only a few basis points above a discounted variable. Maybe they saw something they didn’t like about Canadians’ abilities to handle future rate increases on variables, and BMO is trying to stabilize the portfolio at the expense of margins and shaking up the market. On the one hand, that could be seen as being relatively comforting: distressing that they got worried, but comforting that they’re taking steps to mitigate risk to rate changes. On the other hand, the fixed rate funnel also means that they have now lowered the qualifying rate from ~5.5% to ~3%, and if they needed to take that step to get people to qualify, I quake in fear. OTOH, the 25-year amortization suggests they’re not trying to scrape the bottom of the barrel.

3. It’s about the lack of features. Combined with #1 (adding business down the road), the lack of prepayment means people won’t take as much advantage of the low rates to pay down principal, so upon renewal they’ll get a larger mortgage (or more certainty of that larger mortgage) at the new rate.

On a systematic level, I don’t know what to make of this policy. It could help stabilize the housing market, or contribute to the last hurrah of getting marginal buyers in. For BMO, it could be a shrewd long-term move, or an act of discounting desperation. It’s a puzzler.

The Deceptive Importance of Changes in the Homeownership Rate

March 2nd, 2012 by Potato

One meme out there regarding the housing bubble is that today’s price doesn’t matter because immigrants are going to create so much demand that they’ll support the market. “Toronto has X thousand immigrants. Every year.” To paraphrase & combine a few examples. Thing is, you can’t look at immigration in a vacuum. Ben Rabidoux must be seeing the same chatter, since he also just had a post on population growth.

Consider my shower. Let’s say I just bought the AwesomeSauceâ„¢ 8-head shower system, capable of spraying out an amazing 23 litres of skin-scorching hot water a minute. I clamber on in there, intent on scrubbing away the shame of being a renter.

How long before I flood my house?

You can’t answer because that’s just one part of the problem, on the other side is my drain, taking away the influx.

So for immigration, part of that is just offsetting the natural population decline in the country. The net national growth rate is just a touch over 1%. It’s higher in Toronto and Vancouver, but still just about 2%. For comparison, the US growth rate is about 0.8%, and was running neck-and-neck with Canada over the last decade. Ben has some charts showing how much higher it was in some states that boomed and busted.

Ok, 2% growth per year every year is a fair bit of growth: enough to over-power infrastructure and public transit and the like over time. Toronto is full and getting even more crowded. But is that demand driving housing prices, and will it continue to drive housing prices? How can we consider other metrics in the face of the unstoppable immigration tidal wave?

Another important factor to consider is the ownership rate: in 10 years we went from something like a 65% ownership rate to 70% nationally. That seems like a trivial change: half a percent a year. Let’s try to put that ownership rate change in perspective with population growth to get an idea of some of the trends driving housing:

In the GTA, with all that immigration, we went from 5 million people to 6 million in 10 years. That’s something like 650k-700k new owners created by immigration/population growth (households would be lower by some factor like 2.4X, and about 300k of the newcomers would be renters). We also created 250-300k new owners by increasing the ownership rate. And that’s if you are conservative and assume that the increase in the ownership rate in a boom town is the same as it is nationally.

To get to my point: there’s a limit to how much that ownership rate can be increased. There’s a hard limit of 100%, but even below that, there will be some portion of the population that just isn’t going to buy. Even if we don’t reverse course and bring it back down to 65% — just stay here at 70% — that has consequences. Over the last 10 years, demand has been 40% higher than it “should” have been because of the expanding ownership proportion. We had ~1M (or likely more) new owners in the GTA rather than ~700k expected from population growth alone. If the next 10 years features a reversal of that trend — owners becoming renters again, or the average age of owning pushing back a few years — then demand could swing from 1M/decade to 400k/decade, or a 60% drop. Even just stopping the process of borrowing future demand and hitting a plateau represents a 30% decline in demand from the current run rate.

What will that do to prices? To be fair to my point above about looking at both sides, you have to know what the supply situation will be like. But everything suggests supply will stay robust.

Unfortunately like many other pieces of the puzzle, there’s no timing information with this one: though the US topped out at 70% homeownership, that’s not to say that Canada can’t keep going for 75% in the next decade, or 80% in the one after that. But the seemingly small change in this number represents a very meaningful slice of demand, so it’s important to understand — doubly so because it’s a factor that has changed over time, whereas population growth and immigration have been steady for much more than just the last 10 years.

Default Rate and Seth Klarman on Junk Bonds

March 1st, 2012 by Potato

A rolling loan gathers no loss.

I’ve long said that the mortgage default rate has no predictive value in spotting housing market trouble: it’s a lagging indicator. The reason is very common-sense: as prices increase rapidly, even someone with no equity to start with can refinance after a year or two, or sell and be able to cover the transaction costs. There is no reason to default in a rising market unless you’re particularly bad at arranging your finances and can’t even make it a few months to be rescued by the rising tide.

Then I was reading something about the junk bond fiasco of the 80’s and came across another interesting feature of credit bubbles. As you lend to less and less creditworthy people/businesses, your eventual loss rate will increase — those chickens eventually come home to roost. But firstly, rolling loans gather no losses: with loose credit, and increasing valuations on the underlying collateral, it’s very easy to just borrow your way out of trouble for the short term. Even then, the defaults don’t occur immediately except in the most egregious of cases (which did happen at the end of both the junk bond craze and the US subprime debacle). Another feature is that you increase the size of the lending pool as the credit bubble inflates. So if you look at the default rate, it may be flat even though the number of defaults is steadily increasing — just not quite as fast as the denominator (total credit) is also increasing. That makes the default rate look better than it really is, and doubly so when combined with the lag time before a loan defaults. Seth Klarman says that you could have spotted the junk bond crisis before the bust by looking at the default rate and adjusting for the increase in the denominator.

To give a quick example of how that would work, say your default rate is steady at 1% — this is a level you are happy with and for decades in your industry has been a level that indicates there’s no trouble. Then you rapidly increase the size of your loan portfolio, doubling it within say 6 months. You should have zero defaults on the new loans since they haven’t had time to default, so your default rate should be halved now. If it’s still 1%, you have a problem, and may not realize it.

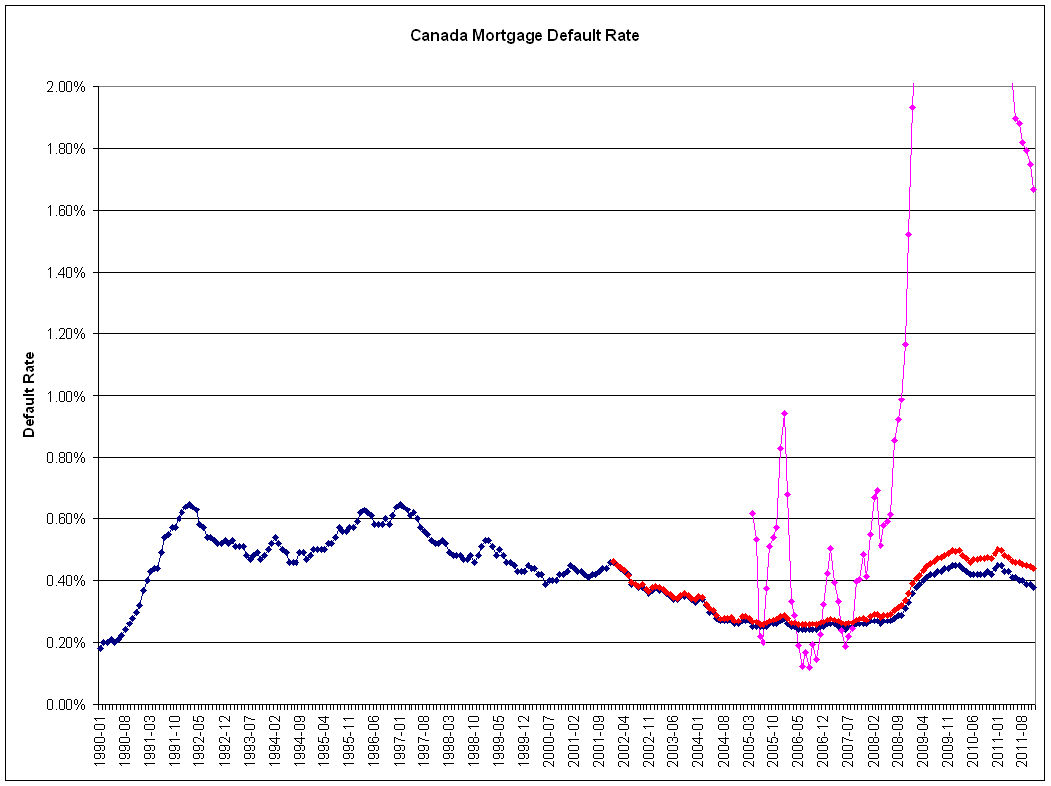
So I went to look up some Canadian mortgage data. As expected, the default rate is low. It was rock-bottom when the 90’s first started, as prices were at their peak there. Then as Toronto’s bubble crashed out and the economy worsened, the default rate increased, topped out at about 0.7%, and then improved. Around the economic crisis and recession in 2008/2009 (also when Alberta prices started their “soft landing”) the rate increased modestly, but is still generally fairly low. That’s the blue line, and is a chart you’ve probably seen many times before.

Canadian mortgage default rates, national. Blue is the traditional measure. Red is the current number of defaults to the traditional mortgage pool. Pink is the default rate on the bubble excess mortgages. Click to embiggen. For the image impaired, this ain't pretty.

But in that dataset is also the total number of mortgages, and that has increased much faster than the population growth rate: if you assume that the year 2002 is a “normal” period to start from, and increase the mortgage size with our population growth rate (1.1-1.2% according to Google), then in 2012 we should have just about 3.7M mortgages. Instead, that number is higher by about 16%. If you then take the number of defaults, and compare them to that denominator, you get an adjusted default rate in red — and that is, by the conservative historical standards of our country, fairly high. And this is still a lagging indicator. But on an absolute basis, it’s still pretty low: while the growth in the mortgage pool has been tremendous by mortgage standards, the dilution of the denominator isn’t as dramatic as it was with junk bonds.

To cut it up a different way, consider the situation as separate pools of mortgages. You’ve got say 3.7M mortgages that represents the normal, conservative Canadian lending market that everyone likes to talk about. These are the people that would own their houses no matter what the real estate boards were projecting, many have been in real estate for decades and have significant equity. With times being reasonably good and house prices being at record highs, we might expect the default rate on this pool to be near its lows of 0.1-0.2%. Let’s be generous and say it’s even higher than that — 0.25% — so this pool of mortgages represents about 9300 of our defaults today.

Then we have the 560k new mortgages that represents all the insanity of the past 12 years: demand pulled forward, low downpayments, long amortizations, teaser rates, fuzzy thinking — whatever it was that drew these people into the market that maybe shouldn’t have been there in the first place. Of that pool, 140k were issued just in the last year alone. Since we don’t expect defaults to occur immediately unless there is a huge problem in underwriting, we wouldn’t think of defaults as coming from those. That leaves 420,000 mortgages issued in the last 10 years that would be responsible for 7000 of the defaults, a rate of 1.7%. The default rate separated out for this pool is put in pink on the graph. As an aside, it goes off-scale in 2009 — in part because the fixed 0.25% default rate assumption simply wasn’t true for the regular mortgage pool (times weren’t great), and in part because that’s when house prices stopped going up and actually went down (briefly).

Now, this is all back-of-the-envelope and full of room for error. This is not the one peg I’d hang my housing bear hat on (that would be price-to-rent). But it is another way of looking at things that I hadn’t come across before.

Housing Bears Must Be Patient

February 15th, 2012 by Potato

Over at CMF user Uranium101 asks when the correction to Canada’s housing bubble will come. He wants to buy a house. I’ve seen similar questions around, or people saying things like they’ll wait a year or a few months or whatever before buying. I’ve been fairly vague on timing for the most part, focusing more on valuations, but it’s a topic worth addressing.

You’ll have to be very patient. On the one hand, we don’t have jingle mail and all the other positive feedback elements that sped up the US crash; on the other, after witnessing that wreck the common buyer may be a little quicker to slam on the brakes, slowing things faster here once the correction does start. Assume the two factors roughly cancel and our unwinding will proceed at about the same rate as the US.

So if you’ve spotted the bubble with good timing near the top (and weren’t early like myself or Mike Burry or whatever), then for the US experience that would be sometime around 2006, maybe even as late as 2007. When is the time to buy? It’s still not clear if the US market has bottomed yet, but maybe around 2011/2012 you agree that even if there is more downside, the fundamentals are back in line and that it’s worth the risk to buy again.

That’s a good 5 years or so. More if you were early in spotting the trouble. Maybe you figure once the major declines started to peter out in 2009 was close enough; that would still be 3 years from the peak you’d have to wait.

Similarly, if in Toronto you had spotted the problems close to the peak in 1989, you’d have had to wait 3-4 years before you’d want to pencil “house shopping” into your day planner.

Real estate is not a fast-moving, efficient market, so patience will be required. But a 30% correction on a $600k house is $180k, and that savings can be even greater if renting is cheaper while you wait. Plus you expose yourself to less risk. Sitting out the insanity will require finding a nice rental you’ll be happy in for several years and patience, but you’ll be very well rewarded for it.

Housing Bear Rebuttal

January 29th, 2012 by Potato

There has been a real barrage of articles about the housing bubble in the MSM lately. Perhaps because January is both a slow news period and a slow real estate period, so it’s a good time to get it all out, or perhaps because the topping process has begun, and the awareness of the problem has started to spread from gloomy spreadsheet addicts like myself to society at large. Based on some very non-scientific mining of Google’s news search, mentions of a housing bubble started to increase about a year before the top in the US, and really were flying wild when the prices finally turned the corner. Here, stories about a Canadian housing bubble roughly doubled last year, to about 500 hits in 2011. There have been over 200 hits already in 2012 — just one month!

Alongside the stories that warn of the danger are ones that try to explain it all away, including two recent ones by Larry MacDonald (who I respect) and Mark Weisleder (who, well, let’s just say he makes these kinds of mistakes a lot). Together, they make a few basic points:

  • House prices have been stable.
  • Immigration.
  • Interest rates are low, and even if/when they do rise, they will be accompanied by job growth.
  • Recourse mortgages.
  • Low foreclosures.
  • High valuation metrics… but, like, so what?
  • Bears only call for a bust due to recency bias, because we just saw a housing bust in the US.

So, to the point-by-point rebuttal machine!

Though some are shared, Mark’s arguments are obviously much weaker than Larry’s. Only he would make the point that housing has been stable and the GTA is nice, so it’s an attractive buy. Of course the converse implies that if housing does start to turn, it will turn badly because that point in favour of buying goes away, and instead becomes a point in favour of selling.

Similarly for his immigration argument: we do get a steady influx of immigrants to Canada (and the GTA in particular). Beyond just immigrants, babies will still be born, teenagers will still turn into twenty-somethings, and people will still move out of their parents’ basements. That was as true in 1992 as it is today. For that matter, it was as true in 1989 as it was in 1992. These things are all true, have been true for a long time, and mean absolutely nothing when it comes time to deciding whether now is a good time to buy a house in Toronto. It means your house won’t be completely worthless, but doesn’t mean a painful 10-35% correction isn’t in the works — as witnessed first-hand by buyers in Toronto, 1989.

The point about low interest rates is also not particularly strong. Even with the recent deals on fixed 5 and 10-year rates, you will be exposed to future rates for a long time when buying a house. After all, the typical mortgage is 25 or 30 years long. It is much better to buy at higher rates and a lower price than to scramble to buy at high prices and low rates. Think of the possible outcomes: if rates move lower, you get a gift and can pay off your mortgage faster. If rates move higher, you face a hardship. If rates are as low as they’ve ever been, the odds are this is as good as it will get, with likely hardship to follow.

Now Larry makes a point about higher rates being accompanied by higher employment, which should offset the price declines that higher financing costs would bring. But to that I simply say: invert it. Prices were up 10% in Toronto last year, and apparently the economy is still just limping along, warranting low rates. So how big of a driver is employment vs interest rates for house prices? To me, that indicates that while there may be a bit of tempering if employment and wages gain along with increases in rates, those are not going to have a large enough effect to counter the decrease in prices that will come from the higher rates. Rates trump jobs when it comes to our housing market.

Recourse mortgages is a common reason thrown around to explain why Canada may be different than the US. It’s an interesting one, too. Sure, if the bank can come after you for your other assets you’re going to be less likely to strategically default and walk away from the house. That’s going to slow the positive feedback cycle, but there’s very good evidence that it’s not realistically that big of a factor. To point out the real-world evidence, again, just look at Toronto, 1989: mortgages were recourse then, too. Didn’t stop the bust. Many US states also had recourse mortgages (including Nevada, one of the few states to escape the housing meltdown — oh, no, my mistake, it’s one of the hardest-hit).

Let’s consider that point in a little more detail. Why doesn’t the recourse action save the housing market? At the core level, the simple answer is because it doesn’t fix anything in the fundamentals: the only way for price-to-rent and price-to-income to come back into line is for price to fall or rents and incomes to rise. So having recourse mortgages may stem the tide and positive feedback cycle of strategic defaults and foreclosures, but doesn’t bring any new buyers to the market. But even then, how much of the tide does it stem?

To answer that question, we have to get an idea of how many strategic defaults there might be vs. bankruptcies. If you can’t pay the mortgage, if you’re severely underwater, and if you have very few other assets, there is really no difference between a strategic default and a bankruptcy — and we still have bankruptcy here. You give the house back to the bank and you start over with nothing. Many people — far too many — have bought in recent years with nothing down and are house poor: aside from their house (with just a thin slice of equity in that), they have very few savings and investments. So to them, there’s no difference between a strategic default and full bankruptcy. If someone has a lot of other assets, then they may have considered a strategic default, but how many of those people are there who also have so little home equity that they’d be willing to trash their credit and walk away, if only it weren’t for that damned recourse mortgage? I’d bet not terribly many. Not enough to matter anyway.

So recourse mortgages aren’t going to stop a housing bust, and are certainly no reason to go out and buy now (if anything, it should give you pause as a buyer).

Hmm, low foreclosure rate. Let’s see, prices in Toronto were up about 10% year-over-year last year. Why are there any foreclosures? Even a 5%-down buyer could sell the place, repay their mortgage, and cover all the sundry transaction fees, taxes, and penalties if they ran into financial trouble in this market. They just had to stay solvent for a year. No, foreclosures are a lagging indicator: only when the housing market is already flat or going down and people are getting into financial trouble does the rate go up, because all other options have been taken away.

Both Mark and Larry touch on valuation metrics. Part of Larry’s point is valid: they don’t tell us about when the correction will come. I’ve been bearish for years precisely because the metrics have been out of line for years. But that said, severe over-valuations like this rarely correct neatly, with a long period of modest negative real returns — “crashes” or “corrections” are the norm. Mark’s point… does Mark have a point? If you don’t like averages, fine, use medians. But don’t compare the nominal number with one method to the nominal number from another: what was the median Toronto income to the median Toronto house price historically, and what is it now? You can’t try to hand-wave the fundamental imbalance away like that Mark, I’m too perspicacious for that.

Finally, to Larry’s point about recency bias: I disagree. I think the recency bias is not clouding the vision of the bears, but rather the bulls like Mark. The last crash in Toronto real estate was 1989, when many current first-time buyers were kids, or gametes. All they’ve known for recent history has been rapidly increasing prices with no risk.

Asides: Mark has a few other points that aren’t even remotely relevant, but I figured I’d rake him over the coals a little more.

His final bullet point about debt ratios shows how clueless he is about what these population measures are showing: for a given person, a debt-to-income ratio of 150% is nothing. Hey, a 25-year-old making $50,000/year who just bought a $400,000 house with nothing down except the closing costs would have an 800% ratio, and people still wouldn’t look at him funny. That person should be able to handle the payments and has lots of time. But what about a retired 70-year-old who has a pension of $40,000 and is $60,000 in debt? That’s only 150%, yet is clearly a much worse situation than the young guy at 800%. So the important thing with these population measures to see how they change over time. The Bank of Canada isn’t worried about one particular Joe having 150% debt-to-income, it’s worried that for a long time that ratio stood at 100% and over the last few years has climbed to 150%. I wonder how Mark would interpret a stat like the average family has 2.3 kids? He must be one of the ones envisioning whole neighbourhoods hiding kids with only a third of a body in the basement.

The closing message about the US not allowing the economy to fall apart in an election year is face-palm worthy. 2008 was an election year, Mark. The reality is that the US government, for all its nuclear missiles and predator drones, is helpless to stop a housing collapse. Ours will be even more impotent since we’ve already burned up the government mortgage guarantee, low rates, RRSP raiding, and extended amortization options.