Book Now in Kobo

November 12th, 2012 by Potato

Please note that PSGtDIYI has been superceded by The Value of Simple

Kobo has changed the way authors can self-publish, streamlining the process to be more like the Amazon Kindle store. As a result, Potato’s Short Guide to DIY Investing is now available in the Kobo store. From my point of view, it’s better if you buy the book directly from me as I get to keep more of the gross, but for you the price is the same whether you buy from Amazon, Kobo, or me: choose what’s most convenient for you.

And speaking of my book, I got some great heart-warming fan mail recently. One of the first people to read my book and switch over to do-it-yourself investing with TD e-series has reported back a year later that things are still on track and that she did her first annual re-balancing all on her own.

A more recent reader wrote in the very same day she bought a copy:

I just bought & looked through your book Potato’s Short Guide to DIY Investing after signing up for a TD Waterhouse Discount Brokerage account and being confused by the interface. The walkthrough for buying the e-Series funds helped me out a lot. Thanks!

I’m very happy that people are finding the book useful, and I’m thrilled that they took the time to send me such wonderful emails!

Finally, I’d like to thank Ellen Roseman for mentioning the book (and the associated coaching service) in her recent column on investment coaches.

Supply and Demand

November 9th, 2012 by Potato

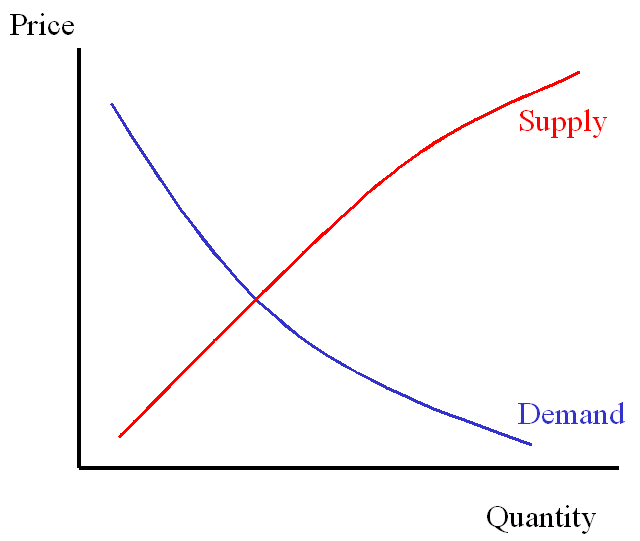
You’ve all heard about “supply and demand” even if only as a back-handed excuse given for why something costs so much. It’s pretty basic economics stuff: even a scientist can follow it. As the price of something goes up, suppliers will be willing to sell more product (and will make changes or substitutions to bring that product to market) while consumers will demand less (and find way to substitute other goods for the expensive ones). Graphically, that looks like:

Generic supply and demand curves.

The shape of the supply and demand curves vary depending on exactly what system you’re talking about, but they have that general property of supply moving up and to the right while demand goes down as you move up in price. (Note that economists usually treat price as the independent variable, and thus have their graphs backwards, but let’s leave that alone – the relationship works either way around). Where the lines meet should be your equilibrium: the same quantity coming to market for both the supply and demand side at a certain price point.

You can then do things to those curves to find what the new equilibrium would be. For instance, if the above graph represents the market for potato chips, we could imagine what might happen in a scenario where say Nelson’s chip truck breaks down. With less supply available, the supply curve would slide to the left, and the price would go up while fewer bags of chips were sold.

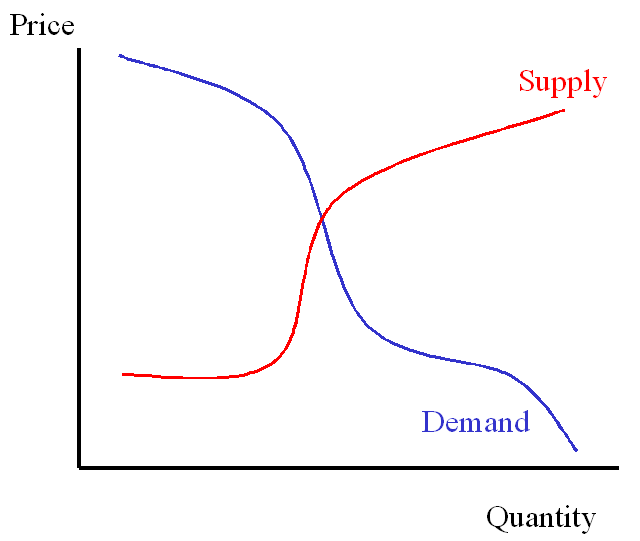
For housing, the demand curve is very flat: most people go through their lives without ever really analyzing the largest purchase they’ll make (and a again, remember the backwards axes of economists — a “flat” curve is actually nearly vertical). They simply get to a point where they figure they can afford it, and they go out and pay whatever the price is to get a house because that is what one does. There are a small number of people at the fringes who can’t afford to buy as prices go up (giving the slight negative slope through the middle), and prices would have to go down a lot before anyone would consider buying a second house. But through most of the range of typical prices, the quantity of demand is pretty stable.

Supply is a little less flat, but still fairly stable compared to many other markets with more substitution options and more responsive supply sources. Above a certain point and you can keep your construction crews operating profitably so away you go. As prices start to get really high supply can start to really ramp up as people get drawn away from other professions to recover supply from the margins (fixer-uppers) or subdivide existing large single units into multiple smaller ones (as seen not only in condos going up over SFHs, but also in Vancouver row houses).

My understanding of supply and demand curves for a normal housing market.

But it’s never this simple in the real world. Supply and demand can be perverse when speculation comes into play. Then you have not just prices versus number of units sold, but also price history as a factor.

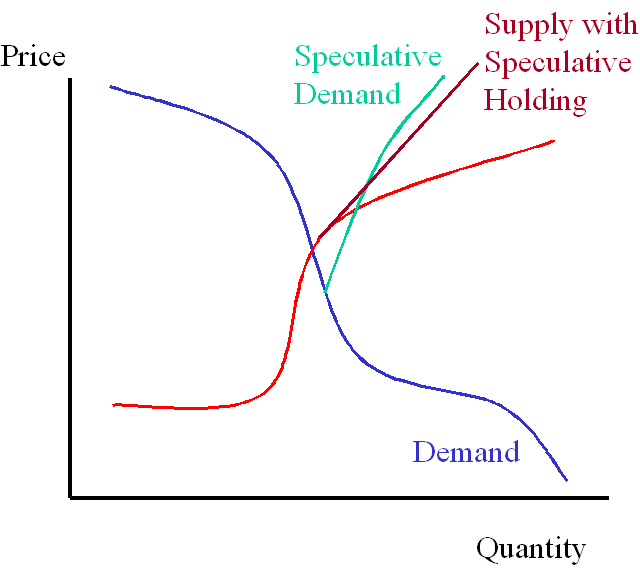
If prices were to rise too far too fast, our simple model of supply and demand suggests that more supply should come into play and demand should drop because of the influence of high prices, creating pressure to bring the market back to the equilibrium point. In a mania though, the opposite happens: the price history turns rational buyers and sellers into speculators. Buyers buy more, either borrowing demand from the future in the form of the buyer who’s afraid of being priced out if prices continue to go up, or from speculators buying multiple units with dollar signs in their eyes. Supply is a little more complicated, as it does definitely respond to the higher prices — that’s evidenced in the real-world by the plague of cranes in Toronto and Vancouver slapping together ever taller and smaller condos. But supply also shrinks a bit with strong price history in what’s referred to as “speculative holding” (at least relative to the supply dump we’d otherwise see). With prices on the up-swing, those moving (or moving in together) decide that rather than sell the old place, they’ll hold on to it, sometimes explicitly for investment purposes, but there are anecdotes of those who do it “just in case” even though they would have never considered that holding if price history was less favourable.

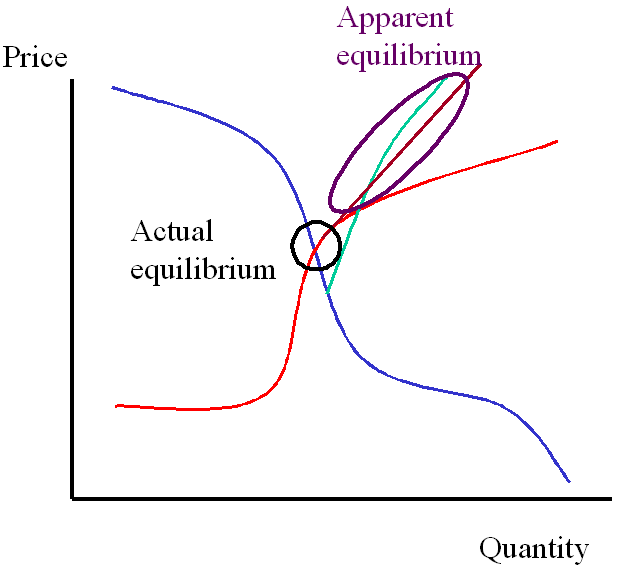
So we see that as prices move up, both supply and demand can increase in proximity to each other, feeding the beast ever upwards (no equilibrium restoring pressures), and the whole time it will superficially appear as though supply and demand are in balance.

It's hard to show a second-order supply curve that depends not just on price but also on the time derivative of price, at least not without a 3-D graph that no one could read anyway... so imagine that the speculative demand curve is moving up along price and not a pure mathematical relationship.

What happens when prices stop rising at a break-neck pace? When they go down a bit – or even just stop increasing – in the so-called soft landing? In a normal market, the lower prices should bring more buyers out of the woodwork to support the new equilibrium. However if it’s not a normal market, but rather one driven by mania and attention to price history, then declining prices are not seen as cheaper but rather a shattering of the speculative world-view. Instead of finding new support for the equilibrium, the speculation in the market dries up. The demand snaps back to the inherent demand curve (which at the high prices, is a lot less quantity) while the same happens to supply (speculative holdings flood the market and listings go up). Supply and demand are “very suddenly!” far apart and there is a lot of pressure for prices to drop back to the original equilibrium.

With speculation bringing in more demand as prices rise, while speculative holding reduces the increase we'd expect to see in supply, the market can appear to be in equilibrium the whole time that prices are shooting ever higher -- and ever-further away from the true equilibrium. Once the momentum is gone and the speculation with it, the market at the high prices will find supply and demand very far apart indeed, with a big drop back to a normal equilibrium.

It is my firm belief that the decline in sales volumes seen in Toronto and Vancouver this summer/fall are the first stages of that. {update from the future: this took about a decade and a half more to be realized}

Now, many are saying that sellers won’t accept lower prices, that they will pull their listings rather than sell at a lower price. This is supported by our conventional view of supply-and-demand, and indeed this is what I expect will happen in the short term. But the speculation also affects the sellers. Those with speculative holdings may no longer be quite so enamoured with the land-lording life (or worse yet, the cash-sucking vacant “just in case” condo), so they may sell a bit below the peak (though the early ones will walk away with personal profits). As price momentum turns negative, the thoughts of holding out for better days turn to fear that negative price movements will persist, and panic sets in. Meanwhile, the builders who pulled out all the stops to meet the crazy demand of last year can’t stop on a dime.

There are many pundits out there with a basic understanding of “supply and demand” and who try to change their vision of the real world to fit that – in other words, they play up evidence that demand is legitimate (whether from immigration or a secular shift in how much of their paycheque the average Canadian is willing to put towards housing expenses) in order to explain high prices. But that simple model doesn’t really leave room for bubbles, manias, and speculation. Of course, I might be wrong — I still have to stop and think about those damned backwards axes every time — but at least the mental model I’m working from has the possibility of generating a bubble. For some bulls, they don’t think there’s a bubble not because of the weight of evidence, but because an overly simplistic model of supply and demand simply doesn’t allow for the possibility.

Buying on Take-over Rumours

November 7th, 2012 by Potato

Someone asked me a few days ago if I thought he should buy some Netflix stock, based on a report that Microsoft was rumoured to be interested in taking it over. I gave him an emphatic no. Not because I had any idea as to what would happen with Netflix — it might very well go through at a really high premium — but because a take-over rumour on its own is no reason to be buying something.

For one, even if the take-over talk is legitimate, by the time the rumour has percolated to you (usually through some form of mass media) it’s too late and everyone has already acted on the news (i.e. the stock price is already up).

For another, there are like 5 take-over rumours for every take-over that actually happens (if the ratio is even that good). Heck, just searching for Microsoft take-over rumours turns up the ones on Netflix, but also Nokia, RIM, something called Yammer (which turned out to be true), Activision Blizzard, Rdio, Glu Mobile, OnLive, EA, Adobe, and two separate ones on Yahoo (one of which was a legitimate offer by MS, and another an unfounded rumour years later).

Of the take-overs that did happen, such as Microsoft buying Skype, I don’t think there was any hint of it in advance.

If the only reason to buy a company is because of a take-over possibility/rumour, and the price has already moved up a bit because the rumour is out there, then you could lose money if/when the take-over is finally denied (see: Yahoo) and the price reverts. If the takeover does happen, then often the price will jump even higher – but a 1 in 5 chance of making 20% doesn’t really work as an investing strategy.

Now that’s not to say that you shouldn’t buy a company just because there’s a take-over rumour swirling: some companies are good values and odds are another company will recognize that and take them over. But if it’s a good value, you likely won’t care one way or the other (indeed, you may wish there wasn’t a take-over so you could still own them – I’ve often felt that way about Teranet and a few other little companies like that that were scooped up by the pension plans in the last 5 years).

Take-over rumours just aren’t a good basis for making investing decisions, one way or the other.

Blueberry Portfolio Month 5 – Sitting on Cash

October 22nd, 2012 by Potato

This is a monthly update from the Blueberry Portfolio. The events I mention below happened approx 8 months ago.

In the last month the index has returned roughly 1%. Our cumulative return is 18.9%, with just over 3% of that in the last month.

We’ve had several investments work in our favour over the last month. Canexus has been a stealthy out-performer: each day it only turns in modest gains, but it has been going so consistently up over the last month that it’s added up to about a 10% return in that short time. Chemtrade, a similar company, has also turned in solid results.

Indeed, at one point Chemtrade had grown enough to hit a completely arbitrary threshold, where it made up 20% of the portfolio. I am aiming to run a fairly concentrated portfolio, but I must balance that with the risk of having too much invested in any one area. It’s very tough to draw that line, especially when an investment is performing consistently well (an old trader’s adage: “don’t shoot a running horse”). But the line has to be drawn somewhere, and 20% is a nice, round number; so when Chemtrade crossed that line I pared it back, taking some profits.

Speaking of taking profits, I also sold our position in Poseidon Concepts. It had a great run, and indeed has kept going up (another 7% since I sold, though it did at least have the good graces to put in 3 down days immediately after I sold to spare my feelings). PSN has sparked many great discussions and reflections on portfolio concentration and when to take profits.

In hindsight, PSN should have been a bigger part of the portfolio than it was. And I don’t mean that in the obvious hindsight bias sense of “it went up phenomenally, we should have had everything in it!” It was a fairly simple company to understand, and I had done a tonne of research into it. It was not followed by any big-bank analysts, so was largely unknown in the investment community. These are things that create opportunity. And while there were of course risks, at those prices we were getting paid to take on those risks.

Wayfare and I had a conversation fairly early on about how much PSN to own given its prospects and how much work I had put into researching it (I believe her expression was “why are you putting so much work into something you’re going going to buy a tiny bit of?”). At the time, I had about 5% of the portfolio in PSN, and decided that yes, we could have more like 7.5-10% in there (I still wasn’t comfortable enough with it to make it any more than that).

That’s where I fell into my own personal psychological hang-up with investing: chasing stocks up. Many people — indeed most — engage in performance-chasing: shunning that which has recently dropped, and piling in to investments that have had good recent performance. For the most part that is a recipe for investing disaster. Recall the classic description of investing: buy low, sell high. Yet performance-chasing does the opposite. For whatever reason, I’m naturally wired the other way around: I see investments that have recently come upon some short term pain as an opportunity to be embraced. But I also am squeamish around stocks that have had strong recent performance. “I’ll wait for a pull-back” I might say, or “I guess I missed my chance.” And I’m inherently distrustful of large short-term moves. So after Wayfare helped me decide that owning more PSN was a good idea, I didn’t follow-through because PSN had run-up roughly 10% in just those first two weeks since we bought. Though it was still very reasonably priced (indeed, it has run another 40% from that point), I just have too much difficultly holding my nose and buying in the middle of that kind of run (even if it turns out that is only the beginning). I made the same mistake in my personal portfolio two or three times in the month of January of this year — it was just a time of running horses.

Anyway, that’s a psychological pitfall I’ll have to find a way to conquer.

Back to the topic of taking profits and sitting on cash: the portfolio is now nearly 20% in cash. I’ve said before that we have had a lot of luck in getting such returns so quickly, and that future expectations should be more muted. This is even more true now: the high-flyers have been sold and the profits reaped; the remaining investments are either the losers, or the ones that are being held for steady dividend payouts rather than any expected capital appreciation. And with a large part of the portfolio in unproductive cash, there should be no reason to have another five months like the first five.

I want to keep the portfolio fully invested, and not have so much cash on the sidelines. But I’ve been finding it difficult to find good companies at attractive valuations to invest in (and just 4 short months ago we had almost the inverse problem: so many good ideas that it was hard to narrow the field down to a manageable number for a portfolio!). In fact, the more I’ve been working to try to find a good investment, the more comfortable I get with having that cash. I’ll do my reading and wait for a fat pitch, but in the meantime things in the market have started to get me a little worried, so some cash — which exists purely to deal with transactional needs and fear — seems appropriate.

So far I have completely avoided the Canadian banks as investments. They have superficially attractive metrics: TD trades at about a 12X price-earnings multiple (P/E) with a decent dividend; CIBC is down around 10X while yielding almost 5%. Yet for years now I’ve been concerned about what a correction to high Canadian house prices could do to the Canadian banks. That has been a prediction with no good time-frame, so I haven’t exactly been chasing others away from the banks. That is starting to change. There is nothing in particular I can point to as evidence that the tide is starting to turn; no graph, report, or spreadsheet that makes the case. But little independent things are catching my attention: Scotia selling a fair bit of stock; TD raising LoC rates; the push for 5-year fixed mortgages, and the speedy reversal of the new year’s promotional rates; CIBC reigning in its subprime mortgage unit; a steady increase in banks borrowing from the BoC rather than each other. In isolation, all fairly normal, minor events, but my brain (granted, one programmed by the conspiracy theories of the X-files) is starting to taste a pattern, and smell the fear coming off the banks.

Impact of Housing Slowdown on the Banks

October 5th, 2012 by Potato

Last week TD came out with a brief research report titled “Canadian Housing – How Bad Could This Get?” that looked at what the impact of a housing downturn would be on Canadian banks.

As a bit of background, banks are in the business of borrowing money from investors and lending that money out to borrowers (as well as other businesses like transaction facilitation and capital markets and what-not). A big component of the money lent out by a bank comes in the form of people taking out mortgages. If something happens in the housing market that affects borrowers and their mortgages, then that can affect the banks.

The two basic ways that banks can be affected is through the balance sheet or through the income statement.

If people stop repaying their mortgages entirely, as happened with many underwater borrowers in the US and Ireland (and was particularly severe in subprime pools), then the bank starts the foreclosure process to get their money back from the borrower, and will likely have a small loss due to the costs of foreclosing (particularly if the size of the mortgage is high relative to the value of the house). If the security that backs the loan (the house) is also worth less because housing prices have fallen, then even after foreclosing and auctioning off the house, a large part of the mortgage may be unrecoverable, and the bank takes a big loss on that. This is a balance sheet problem: the assets (mortgages) are worth less while the bank still has to pay the investors that lent it money. This is a crisis for a bank, and can lead to the bank having to raise more money, get a bailout, or go into bankruptcy.

The TD report says that Canadian banks are not at risk of a balance sheet crisis from a housing market slowdown, and I generally agree: even though we may see some severe price reductions and increases in mortgage defaults in certain Canadian cities, the banks here have been very good at getting rid of their exposure to that risk through insurance and securitization. The mortgages they do hold generally have low loan-to-value ratios, so that even with fairly severe price corrections they won’t have a critical imbalance between their own borrowings from investors and the value of the mortgages they’ve lent out.

The other impact can be felt in the income statement: since mortgages are a big part of a bank’s business, they also make up a large part of where the profits come from. If fewer people are buying houses, and taking out smaller mortgages to boot after prices come down, then the banks will be making less money because of the effect of writing fewer mortgages.

Jason Bilodeau says that there will be some impact of a correction there, but that it won’t be large: he estimates that for a 5% reduction in mortgage growth, the banks would report 7% lower profits. I found that rather surprising: that the impact to profits would be higher than the reduction in activity, though in hindsight it should have been expected of any business with fixed and variable costs.

Thing is, he calls this 5% reduction a “worst case”. That is not the worst case, not by a long-shot: hell, sales are already down 25% in Toronto and over 30% in Vancouver. Those two cities hold roughly 20% of Canada’s population, but the dollar-volume (i.e., the size of the mortgages for the banks) is even higher than that because house prices are also higher. With a bit of back-of-the-envelope math, it looks like the mortgage growth is already in negative territory by about 10% even if the rest of the country was perfectly stable.

One other important factor is that housing activity can change without necessarily changing the size of the banks’ books: a lot of housing activity consists of people who already have houses and mortgages selling to one another. In those cases, it’s possible that no new net mortgages will be written, so there is a case to be made for changes in first-time buyer activity being the important metric, not overall sales. But, I think it’s a reasonable to assume that first time buyers will move with the rest of the market, or if anything, to drop even more in times like these (in rising markets, there’s a sense of “buy now or be priced out forever” leading to more first time buyer activity, and larger mortgages at that as they jump in without downpayments).

So what would the worst-case-scenario look like? Well, in 1989, Toronto had about a year where housing activity was cut in half, and activity only picked up again after price declines set in. Even if the correction was limited to Vancouver and Toronto, with a sales decline of 50% (or some combination of sales declines and price correction) the overall national change in mortgage activity would be more like 17% lower.

At some point I may run through the financial statements of a bank to pull out how much of the increase in profitability over the past 10 years has been due to mortgage credit expansion, and what a correction of ~30% in prices with some decrease in volume would look like to earnings. But unfortunately dear readers, I simply don’t have the time right now. Instead, let’s just extrapolate from TD’s numbers in the report: if a 5% reduction in activity lead to a 7% decrease in EPS, a 17% decline in activity might lead to a 24% hit to EPS.

That’s not necessarily killer: I wouldn’t be shorting banks on that basis, but I wouldn’t be buying them either. Also keep in mind that this still isn’t the worst-case, since many other cities will also likely follow Toronto and Vancouver’s lead. First-time buyers might drop out of the market entirely for a few years, to correct the imbalance in the ownership rate. And people may start making downpayments if they aren’t rushing in to beat price increases.

Using this historical experience as a guide, our sensitivity analysis suggests that our 2013 estimates could be roughly 7% lower, all else the same, if the market were to experience what would be the worst housing correction on our record.

Part of where the low numbers come from is looking at the effect of past housing busts: 1989 was bad in Toronto (and indeed, many regional trusts collapsed), but the rest of the country was fairly unscathed, with Vancouver powering on for 5 more years. Nationally, the banks (and mortgage volume) came out ok. In 1994 Vancouver had a correction, but that was when Toronto was pulling out of its decline. These regional housing corrections have never lead to major problems for the banks before because they were regional and uncorrelated. This time around is going to be much worse than the historical record would suggest because there’s a lot of correlation. Alberta managed to blow off a bit of steam with a soft landing over the past 3 years, but could be sucked in for another 10% down-leg. Ottawa, Montreal, Halifax, Winterpeg and Regina are all equally affected by record-low interest rates and primed for a correction as well.

“In addition to the earnings risk, as is often the case, the cycle would likely be marked by poor sentiment and compressed multiples driving share underperformance. Typically, the group underperforms early in the decline, before recovering as the market looks through to the bottom and eventually improving conditions.”

There are enough investors worried about this, apparently, that multiple compression has already set in. Despite fairly good EPS numbers, most of the banks have gone nowhere since powering out of the 2009 crisis, more-or-less plateauing since the spring of 2010. Once earnings growth turns negative, there will likely be another round of share price decreases, at which point I may look at buying back into the sector.

As an aside, this report begins with the statement “We continue to believe that we are in the midst of a material slowdown in Canadian housing activity.” It’s a very devious statement: throwing in that “We continue” makes it seem like they forecasted this some time ago, rather than, say, just starting to say this last week. Indeed, back in the summer in a report on Genworth, they believed there would be no material slowdown.