Visualizing Data and Situations

September 28th, 2016 by Potato

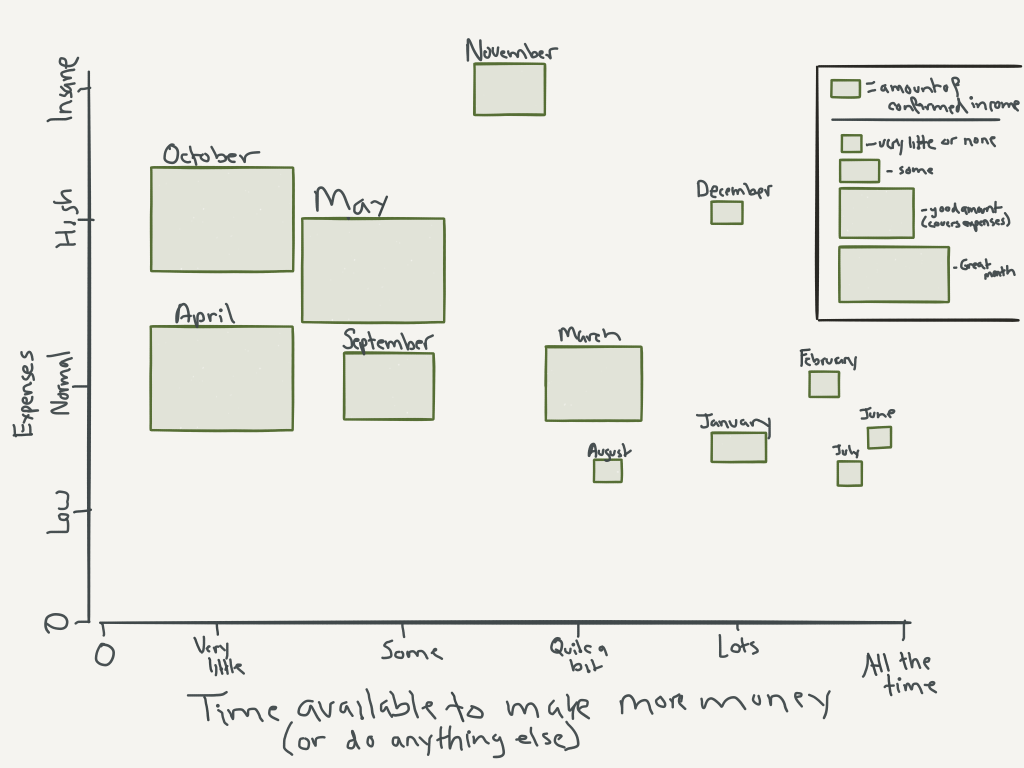
Recently I got an email from Chris (his mailing list is actually good, BTW). He includes these neat sketches to try to understand his money and see things in a new light. A few weeks ago was one on his money infrastructure, which I’m hoping he’ll turn into a post for non-subscribers to see, but the one I want to touch on this week is a sketch of his irregular income through the year that he just sent out. It’s basically a bubble chart (though he uses squares instead of bubbles), showing how his confirmed income varies through the year.

RagstoReasonable irregular income figure

I saw that and thought neat, this is presenting some information in a way that will make people think.

I then thought “this can be presented differently, especially if I would want to use this information to plan my freelancing activities.”

In that figure, he has as his independent axis (x-axis) “time available to make money”, with the months scattered all around, and expenses running up the left side. But you can immediately see a strong relationship between the size of the boxes (committed income) and time available to make money — when he has less committed income, he has more time to make money, which is not very surprising and perhaps not what you want to take away from the chart.

Instead of scrambling the months, we can rearrange it chronologically.

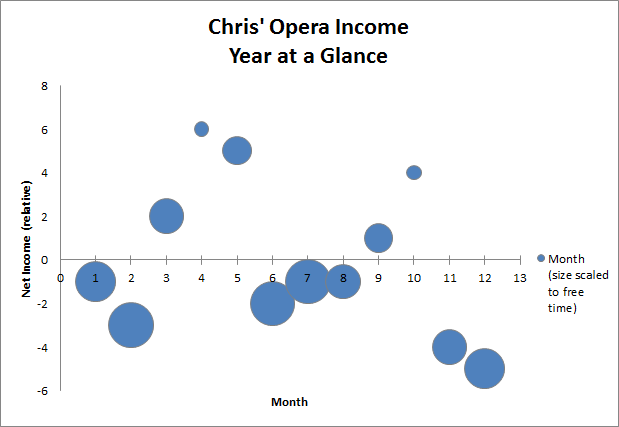
He also has expenses and income as separate variables for each month. Sometimes it’s useful to think about those as separate things, especially when you can attack them from either side. But if you’ve more-or-less figured out your expense side and want to focus on making more money (as the initial x-axis implies), we can instead plot the difference between expenses and income — when are the shortfalls? How do the shortfalls line up with opportunities to make more money? Are there blocks or are they one-off months in islands of pre-committed business?

RagstoReasonable variable income chronological

So now with net income, time available, and time through the year plotted I could use this layout to start planning my side business activities.

As Chris, I could see that from November through February I have a large shortfall in budget, and a decent amount of free time, so this period I’d try to book up with freelance work, with some possibly spilling into March to wind-up (and I’d have to be done for the big Opera period in April). Then in May some time opens up, but the motivation to get stuff going won’t be high as there will still be positive net income. However, there will be minor shortfalls all through the summer with lots of time to spare, so assuming that Chris needs to account for lead time to book clients, he would use the time in May to do that business development, and then work freelance lots through the summer. Then come October, Chris really will have no time to spare, so booking business for the Nov – Feb period will likely have to wait until November (and even then the time is not as open). That means he’ll need to budget to deal with that big shortfall expected in Nov, as it’ll take some time for the freelance income to pick up then.

So here I’ve abstracted away a variable — I’m assuming that I’ve already dealt with planning my [Chris’] expenses, and am trying to visualize the data in a way to help me manage a freelance career on top of a singing career. And this may be a more useful visualization for that particular problem.

But that doesn’t make this a better general approach. After all, some of Chris’ expenses may be variable and flexible, and he would want to plan out when to schedule those based on when there will be money in his accounts after paying gigs, and when he will have time. In that case he’ll want to see income and expenses separately — indeed he may want to collapse income and time available to focus on time through the year and then have different bubbles overlaid for different kinds of expenses. Then he could plop some expenses in different places to see what would fit best for him. For example, he may want to schedule his dental appointments in November and May, when he has time and money after his busy October and April gigs. And indeed, he had just such a visualization sketched out when I chatted with him about this.

With some things in life, especially personal finance, there are many more ways to look at data and to try to present it in ways that help guide different decisions. I’m trying to make use of this more in the course — there’s lots of line and scatter graphs, but also a few simple sketches and pictograms with bunnies. But there’s lots more room to go, and I’m excited to see other people sketching things out in different ways

Anyway, stay tuned to ragstoreasonable as I’m sure Chris is going to come out with some neat visualizations and sketches soon (peerpressurepeerpressurepeerpressure).
Indexing and Valeant/Nortel

September 20th, 2016 by Potato

An active portfolio manager recently criticized index investing because Valeant became the biggest TSX component and then blew up, as Nortel did in ages past. The implication being that active investing would have avoided concentrating so much into a stock like that.

This is a flawed argument. First, he’s suggesting that active management could have avoided the Valeant collapse, which we can’t just take as a given. After all, it didn’t get that way because of the index investors — Valeant became the biggest TSX component because on average active investors gave it that valuation. Now, it’s possible (especially in this case of a cross-listed stock with an international presence) that American active investors are what drove the price up, leading to its over-weight status in the Canadian index (even if Canadian mutual funds didn’t hold it to that proportion), or a small minority of Canadian active investors just going crazy for the stock drove up its proportion in the index, but sparing the portfolios of most active investors.

Whatever, it happened: Valeant became huge then blew up1. That makes 2015 an easy comparison year for active funds versus the index, right? And indeed, over half of Canadian equity funds managed to out-perform the index that year, a massive increase over the typical numbers. However, despite the gimme at the end of the period, nearly two-thirds of funds still under-performed on a 5-year basis — this is clearly not a fatal flaw in index investing.

Which makes it a really insidious sort of criticism because there is a nugget of truth in there. It would be better if bubbles never formed and blew up, but that’s too hard to avoid in practice, and over the long term (which is what matters), indexing is still the better bet. Even if every once in a while the indexes do throw a soft pitch inefficiency to the active investors, it’s too hard to take advantage of (net of fees) consistently enough to win out.

Oh, and while 2015 was a pretty good year for Canadian active investors versus the average, note further down in the report that 85% of US equity funds under-performed the S&P500 that year, and 99% under-performed on a 5-year basis.

Every now and then index investing will include blow-ups like this (or miss run-ups), making an easy comparable for the active managers. Despite the odd case of that happening, over the long term index investing has been the better choice.

1. Fun fact: VRX is the biggest near-miss in my active investing portfolio. Screwing that trade up is perhaps the strongest signal that I’m too busy for even a small active “play” portfolio and it’s time for 100% indexing for me. I decided to short VRX in August 2015, after the AZ Value posts but before Philidor hit the news. I put in an order to buy some puts, but was too stubborn to cross the spread. My bid did not get filled at the end of the day, and then I was too busy with work to enter it again the next few weeks. Then the Philidor revelations came out and I was dumb enough to think that falling from ~$300 to ~$240 meant that I was chasing it down and most of the negative news was baked in. If I had just been willing to cross the spread and pay like $20 more for my puts, or even to come back and keep the bid alive, I would have had about a 15X return on that short. It is no small source of embarrassment and rage and kicking myself that I actually had done the research and entered an order, and still managed to miss out. As Wayfare said, “there’s this great book on passive index investing you should read…”

The Index Card

September 15th, 2016 by Potato

In looking for other descriptions of simple ways to plan and manage your finances, I recently read The Index Card.

The backstory is neat:

When University of Chicago professor Harold Pollack interviewed Helaine Olen, an award-winning financial journalist and the author of the bestselling Pound Foolish, he made an off­hand suggestion: everything you need to know about managing your money could fit on an index card. To prove his point, he grabbed a 4″ x 6″ card, scribbled down a list of rules, and posted a picture of the card online. The post went viral.

An early version of the card is available online at many places, including this story at NPR. The final book tweaked things a bit, but from a quick note surprisingly little changed.

I love the idea of a card like this: a simple set of guiding principles, presented in a really simple way (even the medium of the index card helps reinforce the idea that this shouldn’t be too scary).

However, I can’t say I’d recommend the book for Canadian readers: beyond the real basics of paying off your credit card every month, most of the book is really geared to Americans. With lots of focus on 401(k) plans, 30-year mortgages, and health insurance woes, big portions of this book don’t carry over well across the border. I also wasn’t a fan of the third person voice shifting between the two co-authors. “While working on Pound Foolish, Helaine… Since publishing Pound Foolish, Helaine has sat through… When at the University of Chicago, Harold…”

But let’s move beyond the book to focus on the concept of the index card.

There are lots of things you could include in a high-level summary or set of guiding principles that fit on an index card. And you might build a card differently depending on whether you’re trying to create one for yourself (a la the One-Page Financial Plan), or create a general one to hand out to university students as they graduate or even the public at large.

What specific items to include (and which to exclude), and how to set up such a card is up for a lot of thought and debate. For example, the eponymous index card that Harold made had “pay your credit card balance in full”, but that came after a bunch of stuff on investing and saving. If you’re already saving and investing, do you need that credit card advice, or can it be assumed? If you need to spell out paying off your credit card, shouldn’t it be item #1? And if you have to spell out how credit cards work, do you also need something about car loans? Same with investing: if you already have a point about investing in low-cost index funds, do you need a separate one about not investing in individual stocks? His card also had something political but nothing about donating to The Princess Margaret Cancer Foundation and other charities, which to some people is more important.

There are lots of ways to try to tweak that original card, or to set out to make your own.

Here’s where you need to know your audience: what are the important things to highlight and spell out, and what can be assumed or implied? This is a lot easier if you’re writing a card for yourself than if you’re trying to make the perfect generic card.

Then I think a really good idea is to remember what index cards were originally for and build that in. For those of you who are too young to remember (and those who don’t have an antique card catalogue in your living room to help remind you), before computerized databases and indexing, meta-information about books and other materials at the library was kept on index cards. So you could flip through a stack of index cards to find something you were looking for, then that would point you to the long-from material (a book or file somewhere). Your index card can do just that too: you can write it down on an actual card or use Word or Google Docs to write it out, then link to more information somewhere else. Then if you have a point to make and it’s debatable whether it’s a stand-alone point or really a sub-element of another point, you can include it in the detailed breakdown linked.

So your short summary of personal finance principles can fit on one small piece of cardstock, demonstrating that it’s not all that complicated and that you can do it. But you can link to the more detailed practical information you’ll need from time to time to actually follow and implement those principles. I did something of the sort with the reading guide, but you can set your index card up to link to your own shorter, more relevant summaries.

Here’s how I would set up a generic index card:

  1. Understand why this is important to you. [References: Sandi’s Spanish River talks, posts, One-Page Financial Plan [sic], Wealthing Like Rabbits]
  2. Get out of debt, and stay out of debt. [pay off credit cards, debt blogs, Gail Vaz Oxlade books, etc]
  3. Create a budget, and live below your means. [budgeting tools, different approaches, more books, rent vs buy resource, cars and other big-ticket item resources]
  4. Have an emergency fund and disaster-proof your life. [resources on emergency funds, insurance, Stop Over-Thinking Your Money chapter]
  5. Plan for retirement, even if you love your job. [resources]
  6. Invest for the future in low-cost, broadly diversified funds, using employer matching, TFSAs, RRSPs, etc. [Value of Simple, Practical Investing Course, other resources]
  7. Automate as much as possible to circumvent bad behaviour and improve odds of success [resources on behavioural finance, creating processes, paying yourself first, etc.]
  8. Get help when you need it from people working for your best interest [directory, other resources]

And just like nearly every review of The Index Card suggests changes to the card Harold originally created, this generic card has a lot of room for personalization and discussion & debate. For example, I assumed a lot of things could just be folded under “create a budget”, which otherwise might be rich points of discussion and education on their own. I didn’t mention taxes anywhere, nor pensions or retirement income, but maybe a generic card should include “file your taxes every year”. Nothing about sharing money with a spouse, educating your kids, or paying financial literacy forward, though those could also get top billing depending on the audience. And I could include an ur-point about financial literacy: it’s important, and it’s up to you to learn enough to protect yourself and get by in this world.

What would you include on your own card?

Passive Investing and Non-Linearity

August 2nd, 2016 by Potato

This is a recording of a rant I put together originally for the DIY investing course, but it didn’t quite fit the tone of the course. I didn’t want to throw it away, so here it is as a quasi-podcast for you.

Click here to download the MP3 of the rant.

Transcript:

Markets don’t have simple stories. Market indexes are very useful for simplifying down what’s happening for a quick news report, and with index funds it’s also a handy way to relate that back to your portfolio: if a market index is up, your holdings mirroring that index are also up. But just because we can boil it down to a monosyllabic summary of the action for the day or year or whatever (up/down/flat) doesn’t mean that it’s a simple lever someone out there is pushing, though we like to think of it that way.

We want to think of it that way. We’re comforted by the fairy tales of causation in the news: condition X happened, therefore event Y happened.

It tickles the part of your brain that wants to recognize patterns and fill in the next part. “Here’s a condition, what’s going to follow, onboard pattern engine?” But the damned thing of it is, sometimes there are causal connections, and often there aren’t. If it was just totally random noise we might be able to give in to it, but it’s not — there are some really plausible-sounding stories out there, explanations so great they can explain market moves in all directions.

The stock market is a complex system. It is made up of people (and computers pretending to be people) all acting for their own interests and reasons. Many are only looking at one or two particular companies versus trading a large index. Some are long-term investors unconcerned with day-to-day moves. Some don’t look at the news or events or anything external to the market, making decisions based solely on the trading activity they see other people doing.

I think it would be a really interesting project to one day survey everyone who made a trade and find out why they made the trade that you did. I suspect you would find almost none aligned with the headline in the news that day: “market falls on worries over capital controls in China” or whatever. Instead it would be a thousand different stories that vary from an automatic investment plan to what they had for breakfast to responding to commentary someone else made.

The market average is made up of hundreds of stocks being traded by millions of people around the world, each with their own lives and stories and perception filters, and even though it will all average out to a single, simple result (up/down/flat), it is not because of a single, simple cause.

It reminds me of that quote from Men In Black:
A person is smart. A kind, compassionate being. People are dumb, panicky, dangerous animals. [paraphrased]

One thing I try to explain over and over again when talking about index investing is how hard it is to out-smart the market consistently. The whole point is to try to shut out the non-actionable noise, to avoid forced errors, and stick with a consistent, easy strategy… then move on with your life. It is a very difficult thing to do, because you have to have some kind of faith in the markets, and you have to turn off your pattern-seeker. One of the worst things that can happen to a new investor is to make a decision based on some piece of trivial news, and then make money based on that. Because then it’s nearly impossible to turn off the competitive, out-thinking, out-guessing, pattern interpretation engine.

At a library talk I gave recently I had a number of questions from the audience that I didn’t do a very good job of shutting down: things like recent articles about negative interest rates and how that will affect a passive strategy, or what the cause of Black Monday was in 1987. But the fact that the questions were coming in the first place means I wasn’t doing a good job of explaining that passive, control-what-can-be-controlled philosophy.

To try to explain it again in a slightly different way, there are a few good reasons why the passive approach is a smart one, in other words, why active investing is hard.

1. Lifestyle: it requires effort and expertise to be an active investor.
2. Evidence: even the experts do not have good odds of out-performing when picking stocks.
3. Non-linear: the links between putative causes and investment returns can be very non-linear and non-obvious.

For #3, this is the point I think a lot of people are missing on why it’s just so difficult to be an active investor and out-perform. There’s the efficient market side of it: the market is made up of people with the same information you have, so a news article about something (negative rates or employment or whatever) is difficult to use to get an edge. How much of that were people already expecting, how much will affect future business activity, and how much of that will affect future stock/bond returns?

There’s also the complexities of the connection between the real world and the stock market at play. Monish Pabrai has a flashy slideshow about this, but it’s pretty easy to pull examples out of a hat from the past. There have been many inventions where it has been easy to say “this is going to change people’s lives” and be absolutely correct. Automobiles, airplanes, genetics, microchips, the internet, cell phones — these have all undoubtedly been wildly successful inventions that have changed the lives of billions of people.

And none of that knowledge has been good enough to help you make money as an investor. Even if you knew for sure — even if you traveled back in time with the absolute certainty that in a few decades’ time the sky would be filled with jetliners, the pockets of the passengers filled with devices laden with microchips, and the roads choked so full of cars that a decent marathon runner could jog from the suburbs to downtown faster than a car could take the highway — even then, you would be hard-pressed to make money from that knowledge. Most of the car companies in the early phases of that revolution went bust. Airlines go bust so often it’s a joke amongst investors. There’s been one big winner in the cell phone industry, and it’s one of the companies that started off selling computers.

The internet did indeed change our lives. But it also led to a big stock bubble and collapse, showing the importance of higher-level thinking. Indeed, many of the would-be investors and traders of the time were faced directly with the evidence of the internet’s impact, as they placed their trades online in the new discount brokerages that became available. They could not ignore the impact the internet was making or how fast it was growing. So many of them thought the same thing, and bought the same stocks, leading to the bubble, which blew up and cost many of them a lot of money. It’s not enough to know the first part of the story, but also look at what all the other investors (humans and computers) are doing — what’s priced into a stock, what’s a real opportunity, what’s a bubble brewing?

3D printing, medical cannabis, stem cells, solar energy, machine learning, self-driving cars — Mother. Fucking. Fusion. These may be the next revolutions in our lives. Even if you correctly forecast the coming changes, turning that insight into money by way of the complex, non-linear investment market is so very hard. It is not the simple cause-and-effect relationship the news headlines would have you believe.

A final story: the physicist had a cat, and wanted to know how it worked. So he took it apart, and he had a non-working cat. Living things are chaotic and complex and it is very difficult to precisely map how all of the inputs lead to all of the outcomes. And the stock market is a living thing. You can easily share in its growth as a passive investor, or try to out-smart it – but that is much easier said than done.

July Course Update

August 1st, 2016 by Potato

July has just ended and the Practical Index Investing for Canadians course is progressing well. Roughly 70% of the content is done and online, everything that had been projected for June and July, with a few bonus items as well (though two of the videos are still rendering here, they have been shot and will be up soon). I’ve updated the syllabus here.

The towel-day pre-order price is on its way out. You have until Friday to get the course at the incredible rate of $49 (no coupon code needed — that’s the price that’s set on the course platform site). After that it will go up to the next pre-order level before release, and to the final price in the fall.

The updates will be coming slower now, though. You’ll notice in the syllabus that though most of the course is there, there are only a few things scheduled to be completed in August, and nothing for September. That’s because I know I’ll be too busy at the day job to get any material up through then, so it won’t be until October that the final bits of the course are up and done.

If you have any suggestions (or prefer that I prioritize one section for August) send me an email and let me know!

—-

First time hearing about this? The Practical Index Investing for Canadians course is an online course to help you learn how to become a do-it-yourself investor. It builds on the material in the Value of Simple as well as the Money 201 and other lectures I’ve done since to help you get started as DIY investor.