What Happens in Vegas

February 28th, 2009 by Potato

I went into this movie figuring it would be a very juvenile concept comedy (two people get drunk and married in Vegas!) and would be pretty dumb. But my sinuses were full and I just wanted to put something on while I went to the “nothing box”. Now, this opinion was doubtlessly helped by the facts that 1. I had zero expectations for what this film would deliver and 2. I had taken a lot of cold medicine, but I actually liked it.

It was exactly what it was pitched as: a silly situational comedy where two people get hitched and then have to live with each other. There were a few cheap laughs, but they didn’t resort to over-the-top gross-out stuff, it seemed to stay fairly tasteful and funny. And towards the end, it actually turns into a pretty sweet rom-com. It was surprisingly good (not as surprisingly good as Stranger than Fiction or Dan in Real Life turned out to be, but certainly “not bad”, which is way more than I was expecting). I don’t know if I should bother for a movie this predictable, but…

spoiler warning

… So these two people get married, and win the jackpot in Vegas. Now with $3 million to split they end up going through divorce rather than a quick annulment, because each wants to claim the new marital property. The judge (Dennis Miller) goes on a bit of a rant about how it’s not the gays that are ruining the sanctity of marriage, but people like them who get hitched in Vegas and want out the next week. So he denies the divorce and sentences them to “6 months hard marriage”. If either of them gets caught not making an effort of making the marriage work, they lose their share of the $3 million.

They start off nearly at each other’s throats, playing silly little pranks, and trying to get the other to break the marriage. As can be expected for a rom-com, they start to see each other’s points of view and start falling for each other. Now the point where this movie really started to work for me was right where we can see that they’re actually starting to make it work, and they’re in a hotel room for a getaway, and there’s actually some chemistry, some spark in the air. So as they get undressed for bed there’s this tension, and you figure ok, this is a Hollywood movie, so this is the point where they’re going to sleep together and have a happily ever after. But they don’t — after a meaningful glance, he goes to sleep on the couch, she on the bed. The divorce goes through the next week. Finally free of each other, they then seek each other out again to start over, properly, slowly. I found it to be a very satisfying ending, it seemed a lot more real and meaningful to me than the quick and easy ending that I saw possibly happening in the hotel room.
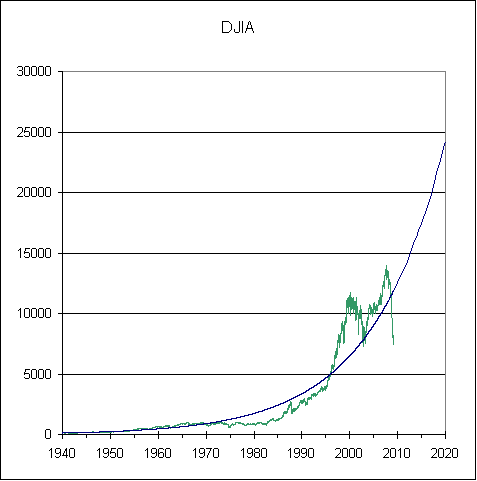
Answering the Question No One Dared To Ask

February 27th, 2009 by Potato

Yes, blank pages do get their own DOI classification.

Sid Meier’s Railroads!

February 26th, 2009 by Potato

Carefully picked out of the discount dustbin, Sid Meier’s Railroads! is a fun little minigame to keep yourself busy and relax with when you’re home with a head cold. There isn’t much depth to the game: you have cities with industries and sources of raw materials; build train tracks and buy trains to bring one to the other (and to move goods and people between cities). You can play with just your own model railroad, or compete against others (humans or AI) to see who can become the biggest railroad tycoon first.

While there are maybe 20 different industries in the game, they’re segregated by scenario so you can only encounter 8-10 of them in any given game you play. Like I said, there isn’t much depth to the game: you can choose to deliver to industries and make money on the shipping, or buy them up to earn it manufacturing as well… but not a whole lot to play with beyond that. Whether industrial output grows or not is a function of how long the industry has been active; you can’t choose to pay to upgrade. Sometimes it feels like I should be playing it through a flash-enabled web browser.

The game’s scale is way off: when playing the midwest scenario for example, a single 8-car train stretches nearly the entire 400 km distance from Toronto to Detroit; it’s impossible to route a train from Toronto to Niagara Falls because the “turn is too tight”. You’re constantly battling the terrain in this way, a gameplay mechanic that by all rights probably should be there, but stands out as silly at certain times (trains really don’t have a 300-km turning radius in real life). The biggest complaint I have about the game is that the train routing is really, really dumb. Since routing trains is just about all the game does it’s especially aggravating that it does it so poorly. Each track can only take one train at a time — despite how far out the game map seems to be zoomed from real terrain, you can’t take things like sidings for granted. Each city can only have 3 unloading tracks in it. So once I start having a large number of trains I like to spend the money to build parallel tracks — an eastbound and a westbound lane if you would. I put crossovers through the network so trains can shunt around as needed, and so the two travel tracks can split to the 3 station platforms… and the trains still get stuck. If there’ s a single train moving between two cities in a setup like this, it will invariably take every crossover (slowing itself down — trains move fastest when going straight ahead) instead of just going straight on the clear, open track it was on. Most of the time, the trains will manage to split up and make the most of the 3 station platforms, but not all the time. Every so often you’ll look at a city, see an open platform, and a train just sitting there, perfectly capable of switching over to it, but instead waiting and waiting for the occupied platform to open up.

Laying track goes easily enough: the game automatically throws in bridges or tunnels as needed to get from point A to point B. Most of the time, branching works fairly well… but again, it’s infuriating when it fails. You can click from one track to another to build a connection, and sometimes it just simply won’t see the second track and you’ll be left with an orphan piece running under the track you were trying to connect to. Sometimes, in the brilliance of the train routing, the trains will take this piece of track to nowhere, get stuck for a few seconds, then magically teleport to the other track. So I guess in a sense those “connections” do sort of work… kinda… and slowly.

However, there’s something about watching the electronic trains make their way around the map and tooting their steam whistles that appeals to the child in me.

No Flu This Year!

February 25th, 2009 by Potato

Ever since I started working in a hospital I’ve been getting sick like crazy through flu season. It’s not for lack of getting the shot, which I’ve gotten all but one year. The flu shot isn’t usually available to us until mid-November, but for three of those years we got hit early and I got sick around mid-October. One year the shot was admittedly mis-formulated (they have to pick ~3 strains to include in the vaccination, so it’s a guess as to what the problem virus strains will be each year, well in advance of flu season), and nearly everyone got sick. But this year I seem to have finally avoided it: I made it to mid-November without getting sick, got the shot, and I’ve been going crazy with the vitamin B & C pills, plus trying to keep my sleep somewhat normalized (tough given that I had overnight scans in the fall). Now flu season is almost over, and I think I’ve made it through.

Ok, as I’m writing this I am a little sick, but not with the flu — I have a minor head cold and sore throat, but no fever, no body aches, and no alien organisms growing in my lungs!

Log Transform

February 23rd, 2009 by Potato

I was playing around with some data analysis here at work, and decided that I’d try to do a little log transform on some stock market data. Generally, you expect the market to increase exponentially over the long term. This leads to some pretty big numbers after some time, so a chart looks something* like this:

DJIA over 100 years

It’s an impressive chart, however the thing about exponential growth is that after a century we’re dealing with some very large numbers. In fact, the last few decades seem to dominate the chart: the recent market crash and the tech issues in the 2000’s appear, on that chart, to be way worse than the great depression, which looks like a small blip in the 30’s down in the bottom of the range. We could of course zoom in on that region:

DJIA focus on 1925-1934

Showing that there was a big nasty swing in there.

So one way to better look at data over the real long term like this is to do a log transform (in this case, I chose base 10). That takes an exponential growth curve and makes it linear. Now instead of being dollar value up the y-axis, we now have powers of 10.

Log (base 10) transformation of DJIA, 100 years

This is a different way to view the data. To my eye, the long-term trends seem to stick out more, and the current crisis can be put into perspective with past issues. The stock market crash of the 30’s, from about 380 to 41 was a fall of almost 90%, or about a drop of one power of ten, which would be 1 unit on the logarithmic scale. Right now we’re down about 50%, or 0.3 on the log scale.

I like looking at the log plot, because it shows that over the span of multiple decades that there is some consistency to the stock market going up, and that while this recent disappointment is crushing (down another 3+% today!) it’s not totally unprecedented. It also helps restore my sanity after reading some extreme bears who point to that 100-year chart and say that the world went crazy in 1985 and everything that happened after that was crazy and volatile and that if we fit a line to the rest we’d be back down to 2000-4000 and that’s where the Dow is heading! Of course that’s really just an artifact of the magnification of exponential growth — you can’t fit a linear trend to an exponential curve (ok, for small values you can, which is exactly the error they’re making!). If you want to draw a straight line, then you should work from the log plot. While I don’t put too much faith in chart divination, I think I might have this one printed off:

DJIA 1940-present with trendline

The market can underperform for a long time (the market can stay irrational longer than you can stay solvent, as the saying goes), but with a timespan of 20-30 years (when I’ll be 50-60) it should come back to that long-term trend. It doesn’t help me figure out when we’ll bottom, or when we’ll get back up, or even for sure if that’s an accurate projection of what will happen in the future, but it will help me sleep better knowing that essentially all of my net worth is subject to the whims of the market. For the curious, here’s what that same trendline looks like on the untransformed data:

DJIA with exponential trendline

Exponential growth is everywhere in nature, but I bet at least half of you are shaking your heads at that 25,000 by 2020 extrapolation! It’s just so hard to wrap your head around numbers that large, though that would only be a ~6% return per year from the peak (about 11% per year from where we are now).

* – Note, I was getting some Y2K errors with the data I have (starting from 1900 — I just did a Google search for DJIA historical data and took the first one), I think I fixed it up, but might have made some mistakes. Feel free to fix if you like. To improve on this analysis you can include dividends, inflation, and compare multiple countries (I doubt things would look as good in Japan, for example) or run a monte carlo with sample portfolios to get some confidence intervals. These are left as exercises for the reader.

Also, for those on the RSS feed, the images may not come through. Try viewing in your web browser.