Wonky Buy vs Rent Calculator
December 11th, 2013 by PotatoOne of my shining triumphs here has been to create (with generous help from Matthew Gordon) the ultimate buy-vs-rent calculator tool (direct link to the spreadsheet).
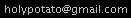
The beautiful thing about a spreadsheet-based calculator like that is that you can follow the calculation, item-by-item, and check it for bugs if you get unexpected results. Earlier this week, B&E posted a list of calculators out on the net, and rather than linking to my supremely excellent calculator and associated post, Robb linked to a Get Smarter About Money calculator. Ok, it’s web-based and a little more user-friendly than a spreadsheet, and has graphs and sliders (though why you need house price to go up to $10M is a question left unanswered)… but was it accurate? I’ve seen many, many terrible buy-vs-rent calculators (even some seemingly excellent ones like the famous New York Times ones that just doesn’t work for Canadians due to tax differences). So I played around with it. And I quickly saw wonky results like this:

In the comparison I have there, the price-to-rent multiple is 260X ($2500 monthly rent on a $650,000 house); as we’ve learned from previous posts in realistic scenarios it should be better to rent with prices so detached from rents. Yet here the calculator is showing a rather large benefit to buying if you can only wait 7 years or more. Then, strangely and inexplicably, renting rapidly takes the lead in the final few years of the comparison, with some sort of apparent discontinuity at year 30. If you look at their “chart” you can see more errors immediately: I had entered $2500/mo in rent, which is $30,000 per year, yet the “total renting expenses” came to just $12,360 in their chart, a factor of three too low. The buying expenses were only about $31k in their chart, whereas the mortgage alone is that much, with a total cash outlay of nearly $45k each year.
Now if you instead do the same comparison in my calculator, you’ll find that renting beats buying right from the start (due to the high transaction costs), and is fairly flat in terms of net benefit for about 10 years, at which point the investment portfolio starts to get large enough that investment returns become comparable to rent and the exponential growth becomes truly noticeable. There is no big “buying is better” hump in the middle. Moreover, the magnitude of the difference is notable: in my calculator renting beats buying in such a scenario by over $600,000 in year 30, versus the nearly break-even result from this scenario in the flashy online tool, with the same assumptions regarding investment returns, inflation, mortgage interest, and other sundry costs.
It’s a bit distressing, as other online calculators have recently been found to have serious errors as well. For instance, Michael James uncovered one on the Globe & Mail’s site, and just today news broke on retirehappy about the government’s CPP calculator over-estimating your future CPP benefits and not at all handling early retirement scenarios correctly.
Footnote: let’s say you’re not convinced that my spreadsheet is the gold standard to which all other rent-vs-buy calculators should be held. To then check the accuracy of the online calculator, let’s run the first year’s numbers manually:
Buying: mortgage $31k, property tax $6k, insurance $1.7k, maintenance $6.5k; total cash cost: $45.2k. Principal paid down: $16.5k. Net cost of owning: $28.7k.
Renting: rent $30k, insurance $0.4k; total cash cost: $30.4k. Investment portfolio gains: $10.5k. Net cost of renting: $19.9k. Cost to sell house: $39k. Gain on house: $15k. After year 1, renting ahead by: $49.3k. Online tool says: $16k.
If you notice any errors let me know.


 Questrade: use QPass 356624159378948
 Passiv is a tool that can connect to your Questrade account and make it easier to track and rebalance your portfolio, including the ability to make one-click trades.
December 13th, 2013 at 1:43 am
Further testing reveals:
Costs of selling a home are only factored in for year 30, not the given selected year. That’s what causes the year 30 discontinuity.
The investment of the downpayment and the rent costs seems to be handled weird too. I tried a ridiculous scenario where an all-cash purchase of $1,000,000 was made with no other buying costs (no tax, no maint, no commissions, no inflation, nothing), and a renter that invests at 2.4% with rent of $2000/mo. This should be a perfectly break-even scenario: the renter invests his million bucks, and makes just enough return to pay the rent. The owner simply lives for free, with a million dollars tied up in equity. Yet the calculator is showing that the renter comes out ahead by $300,000 over 30 years. Upping the rent to $2900 bizarrely shows the buyer coming ahead at first, then turning around to end at break-even in an inverted parabola.
It appears that what’s happening is that a proper apples-to-apples cashflow analysis is not happening: the accumulated rent is being straight-line subtracted from the compounded growth in the downpayment. The owning case is not building up the difference (or equivalently the renter’s nest egg is not being eaten away by the rent when the monthly cost is higher than the buying case).
I think something funky is happening with finding the “difference” to then invest when there is a mortgage involved, but I haven’t reverse-engineered it yet.
December 13th, 2013 at 10:39 am
I recently had to decide if I wanted to stay in the house or sell and move to an apartment, for external reasons. I put together a reverse calculator to model what would happen in both cases and even with conservative assumptions it turned out to be a big win for renting. In part this is because I can move to a smaller place, but it also doesn’t account for other benefits such as not having to repair things (which can take up a lot of unpaid time), being in a better location, being able to move at will with minimal costs, etc. It appears that after 10 years the investment gains will be as much as the rent. I couldn’t get the parameters to line up in your calculator but it also shows a more modest advantage for renting.
January 9th, 2014 at 2:34 pm
I played around with your calculator for Toronto and I found that even if I put in my “reasonable” estimates for a home around $350,000, and lowered the returns to 5%, and then put most of the purchase in cash (e.g. down payment to 90%), only THEN after 5 years or so would it be better to buy.
January 9th, 2014 at 10:41 pm
Yeah, in addition to the valuation in Toronto, it’s tough to make a case for buying for a short period (I cringe when realtors say they’re selling tiny condos to clients, but it’s ok because they only plan to live there for 2-3 years). The land transfer tax pushes out your parent’s old 7-to-10 year rule of thumb by another year or two.